***For more complete information please refer to the final project report, see link to PDF at the bottom of this page. All figures below are taken from this report.***
Motivation
Climate change leads to modified hydro-meteorological regimes that influence the discharge behaviour of rivers. This has variable impacts on managed (anthropogenic) and unmanaged (natural) systems, depending on their sensitivity and vulnerability (ecology, economy, infrastructure, transport, energy production, water management, etc.). Therefore, decision makers in these contexts need adequate information (i.e. “informed options”) on potential future conditions to develop adaptation strategies in order to minimize adverse effects of climate change.
Objectives
The main research question of the RheinBlick20502 project is: What are the impacts of future climate change on discharge of the Rhine River and its major tributaries? The RheinBlick2050 project is initiated by the International Commission for the Hydrology of the Rhine Basin (CHR). It reaches its core objectives by:
- developing a common research framework, which is coordinated across participating countries and institutions (Fig. 1);
- acquiring, preparing, (generating) and evaluating an ensemble of state-of-the-art climate projections for future time-spans and related discharge projections at representative gauges along the Rhine River and major tributaries considering uncertainties;
- condensing heterogeneous information from various sources into applicable scenario bandwidths and tendencies of possible future changes in meteorological and hydrological key diagnostics (Fig. 6).
Project group
The RheinBlick2050 project is a coordinated effort on the non-tidal catchment, initiated and coordinated by the International Commission for the Hydrology of the Rhine Basin (CHR) closely collaborating with the International Commission for the Protection of the Rhine (ICPR). Data, methods, models and expertise of different institutions and research activities of riparian states of the Rhine River are jointly combined in this so-called “meta” project with a runtime from January 2008 to September 2010. Partners are from the Centre de Recherche Public – Gabriel Lippmann (Luxembourg), Royal Netherlands Meteorological Institute (The Netherlands), Rijkswaterstaat (The Netherlands), Hessisches Landesamt für Umwelt und Geologie (Germany), Bundesanstalt für Gewässerkunde (Germany), Deltares (The Netherlands), Cemagref (France) and Bundesamt für Umwelt BAFU (Switzerland) (Fig. 1).

Fig. 1: Overview of core project group members (final report authors) and logos of their respective institutions. Note that the respective contributing projects are not listed explicitely.
Experiment design
The experiment design uses a data-synthesis, multi-model approach where a selected ensemble of finally 20 dynamically downscaled transient bias-corrected regional climate simulations (control runs and projections) is used as forcing data for the HBV134 hydrological model at a daily temporal resolution over the catchments of the Rhine River (Fig. 2).
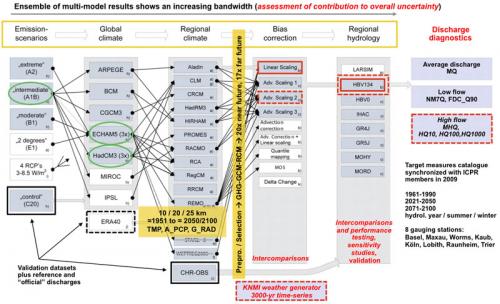
Fig. 2: Research framework of the RheinBlick2050 project. Overall experiment design with data used, schematic modelling and processing chains and analyses components. Grey boxes denote components which are used in our framework. Although distributed over different institutions, this framework is characterised by a high level of automatisation. A “standard” model chain for impact assessments forms the core of the study: greenhouse gas emission scenarios force the GCMs, whose data is used as input to some sort of regionalisation (dynamical or statistical downscaling); what follows are further processing steps (incl. bias-corection), hydrological model runs and finally the derivation of impact diagnostics. Work within RheinBlick2050 starts basically with the retrieval of RCM simulation results. Grey boxes denote data, methods and models used in the study. For each data type reference data exist (e.g. observed discharge time-series, hydro-meteorological reference data, etc.). Due to the availability of data there is a certain imbalance in the model ensembles: the SRES A1B emission scenario dominates as well as ECHAM5 and HadCM3 GCM model runs. From the RCM simulation results near surface air temperature, total precipitation and global radiation is used at a daily resolution from 1951 to 2100. After pre-processing and model selection (due to suitability criteria) overall 20 SRES-GCM-RCM combinations remain which are bias-corrected. From a number of methods available four are used. For meteorological analyses, average flow and low flow target measures, the linear scaling bias correction suffices, whereas for the hydrological simulations with HBV134 for high flow, the AS2 non-linear bias correction is used. A number of sideline studies is conducted to test and validate the data, methods and models used (red colours, italic text). The discharge diagnostics are synchronised with the stakeholders within the ICPR. Only a subset of the requested diagnostics can be considered though.
An extensive model chain evaluation procedure, a hydrological model intercomparison and performance testing (with overall eight different hydrological models) as well as simulated discharge validation studies (Fig. 3) ensure the suitability of the methods and models used. Regional climate model (RCM) outputs are mainly used from the EU FP6 ENSEMBLES project based on the A1B emission scenario and various driving global climate models (GCMs) (primarily HadCM3 and ECHAM5). Additional runs available from different research projects and institutions are also included. A weather generator is applied to generate long time-series of forcing data especially for high flow studies.
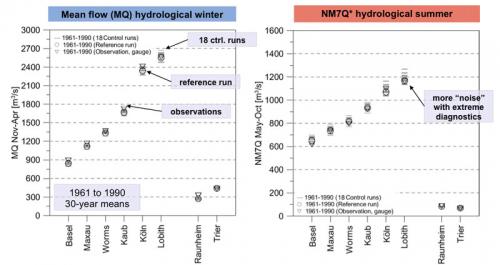
Fig. 3: Example of validation studies as part of the data and model evaluation and suitability efforts. Each horizontal line represents one model chain realisation including the calculation of diagnostics. For the reference period 1961 to 1990 the long-term (30-year) hydrological winter mean flow (MQ) based on the complete model chain (SRES-GCM-RCM-bias correction-hydrological model) (18 ctrl. runs) deviate only slightly from the reference run (HBV134 driven by the hydrometeorological observational reference dataset) and the in-situ observations. A similar result is obtained for the NM7Q low flow diagnostic for the hydrological summer. The NM7Q as used here is defined as the lowest arithmetic mean of 7-day discharge per time-span (here: hydrological season) and averaged over 30 years. All discharge diagnostics are validated; highest confidence is in MQ; the complete processing chain yields reliable results. In comparison with the other lumped models tested as part of the hydrological model performance testing (Fig. 2) the HBV134 seems to be most reliable with less than 5% errors and more than 90% of the variance explained.
Different bias-correction techniques are implemented, compared and used in order to correct systematic deficiencies in the climate model outputs (Fig. 4).
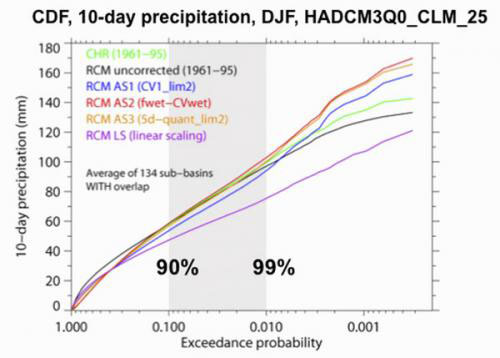
Fig. 4: Bias corrected (blue, red, orange, pink), uncorrected (black) and reference (green) cumulative distribution functions for 10-day precipitation for the meteorological winter (DJF) based as an example on the A1B-HadCM3Q0-CLM (25 km) model combinations. Base data are spatial averages of the 134 HBV model catchments in the Rhine River basin. The 10-day precipitation is especially relevant for the evolution of high flows. It can be seen that for up to 90% of all cases the different bias corrections perform likewise well in correcting the overestimation of precipitation by the RCMs. For the more extreme precipitation events it becomes obvious that the linear scaling method (pink) has exspectable deficiencies. For less than 1% of all 10-day extreme precipitation events this is also the case for the non-linear bias corrections (diverging CDFs).
Based on this ensemble, future changes in specific diagnostics for mean discharge, low flow as well as high flow (incl. bandwidths) are investigated for eight selected gauging stations along the Rhine River down to Lobith as well as the Main and Moselle river tributaries (Fig. 5). These analyses are coordinated with the requirements of the potential users and stakeholders from government agencies. We look at near and far future scenario horizons, i.e. 2021 to 2050 and 2071 to 2100. A focus is on changes up to the year 2050 as the near future is particularly relevant for planning issues and the RCM data availability is better up to 2050. We use scenario bandwidths and tendencies in order to analyse the bandwith of the diagnostics result and to communicate uncertainties (Fig. 6).
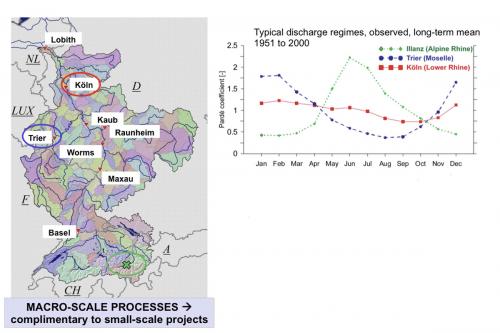
Fig. 5: Map of the Rhine River basin up to the German-Dutch border at the gauging station Lobith (NLD). The colour coding reflects the 134 HBV model catchments as used in the project. Gauging stations selected are along the Rhine River, the Moselle (Trier) and Main (Raunheim) rivers. The distribution of these gauging stations shows already the focus of the study on macro-scale processes. The right-hand side of the figure shows typical discharge regimes of the Rhine displayed as annual cycles of observed long-term mean (Nov 1951 to Oct 2000) monthly discharge expressed by the Pardé coefficient (ratio of long-term monthly mean discharge and the annual mean discharge). The snow melt driven nival regime of Illanz stands out against the pluvial regimes of Trier. In Köln the annual cycle is smoothed very much; it reflects a combination of highly different discharge characteristics of the major tributaries upstream.
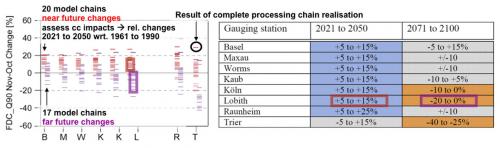
Fig. 6: The left plot shows the changes of the low flow measure FDC_Q90 (90th percentile of the flow duration curve, i.e. the discharge value undershot at 10% of all days in a 30-year period) in the near (2021 to 2050) and far future (2071 to 2100) with reference to the period 1961 to 1990. Each horizontal line represents a complete realisation of the modelling chain. Despite the large bandwidth, clusters can be seen in the distribution. This information can be used to derive scenarios from projections. By defining sceanrio bandwidth and tendencies (for details see the report) qualitative and quantitative measures are combined. The full information is retained, the bandwidth is narrowed; it is a transpartent procedure, easy to apply, extensible and it is in line with good practice recommentations. The table on the right shows, aided by a colour coding, an excerpt of results form the application of the scenario bandwiths and tendencies methodology. Colours indicate an increase (orange), decrease (blue) or no tendency (grey). Bandwiths are rounded to 5% or 0.5°C.
Results – summary
Based on a consistent experiment design a joint, concerted, international view of climate change impacts on discharge of the Rhine River is developed. There are variable uncertainties and reliabilities assigned to the individual results for mean, low and high flow. The discharge projections presented here give an indication of the changes in the hydro(meteoro)logical system of the Rhine River and its catchments as a result of climate change projections that are regarded the state-of-the-art in 2010.
Meteorological changes
The bias-corrected regional climate change projections show a spatially rather uniform increase in 30-year long-term mean air temperatures throughout the basin and the meteorological seasons. Changes range from 0.5°C to 2.5°C in winter and no changes up to 2.0°C in summer for the near future. For the far future, these changes increase, ranging from 2.5°C to 4.5°C and 2.5°C to 5.0°C for winter and summer respectively. Overall the change signal in winter is more clearly defined. The precipitation change signal is more heterogeneous (especially in spring and autumn) and shows a larger bandwidth, especially in summer and in the far future. Spatial patterns of precipitation change point towards rather uniform increases in winter up to 15% in the near and 25% in the far future. Only in the far future decreases between 10% and 30% evolve in summer. Near future projections show no clear tendency in precipitation (Fig. 7).
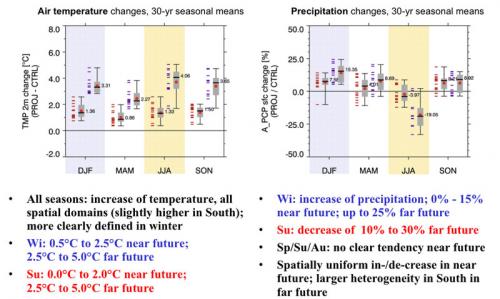
Fig. 7: Seasonal changes of basin-wide mean air temperature and precipitation during the meteorological seasons. For the near future 16 and for the far future 13 model chain realisations are considered. Apart from the individual realisations the Box-Whisker-Pplot summarises this distribution statistically (Whisker: minimum and maximum, box: lower and upper quartile, horizontal line and value: median, red dot: arithmetic mean.)
Mean flow changes
For the average annual discharge tendencies to increase are found for Kaub, Köln and Lobith (0% to +15%) for the near future, while for the far future no further tendencies are seen here, which is related to opposite changes in winter and summer. Only for the gauging station Raunheim, tendencies are identified for the near and far future alike. Clear trends are found for the hydrological summer and winter. The mean hydrological winter discharge tends to increase in the near and far future (0% to +25%). For the summer an opposite tendency is found for the far future, i.e. a decrease of 30% to 5%. Raunheim is again the exception with an identified tendency to increase for the near future. For the upstream part of the Rhine River a slight change towards a more rainfall-dominated flow regime, as found in the lower part of the river basin, can be distinguished. The month with the lowest as well as with the highest discharge of the year tends to be earlier (Fig. 8, Fig. 9).
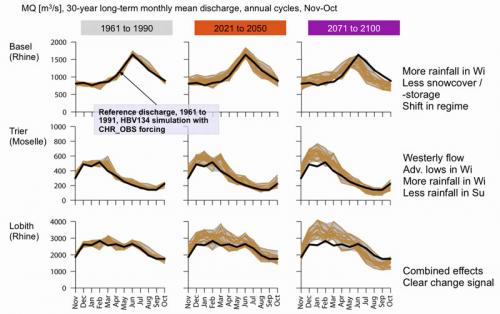
Fig. 8: Modified discharge regimes throughout the basin. Towards the far future there are obvious changes in the overall discharge regimes at all three selected gauging stations in this example. There is a “pluvialisation” of the regime in the Apline part of the catchment (Basel) with less snow in winter, more rainfall, hence less water storage in the snow cover and hence a change in the late spring / early summer peak discharges. Precipitation regimes in the mid mountain ranges such as in the Moselle river catchment show increasing winterly advective precipitation types and less precipitation and discharge during summer. The increase in bandwidth (grey shading) is remerkable, albeit the change signals are consistent with each other concerning the direction of change.
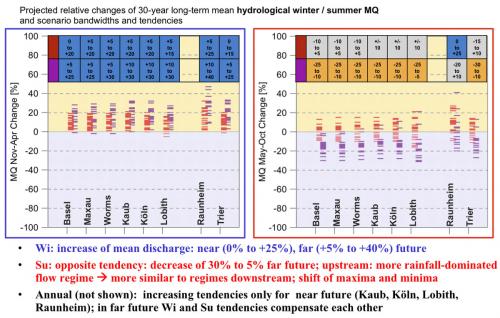
Fig. 9: Relative changes of average discharge for hydrological summer and winter for 8 gauging stations. The table at the top contains the results of the scenario bandwidth and tendencies analyses (Fig. 6).
Low flow changes
With respect to low flow we see no strong development in the near future; while most ensemble members show no clear tendency in summer (ranging from +/-10%), winter low flow is even projected to be alleviated (0% to +15%). For the far future, the change signal is stronger in summer, with a tendency towards decreased low flow discharges (-25% to 0%), while for winter no clear signal is discernible (bandwidths are mainly from -5% to +20% depending on discharge diagnostic and gauging station) (Fig. 10).
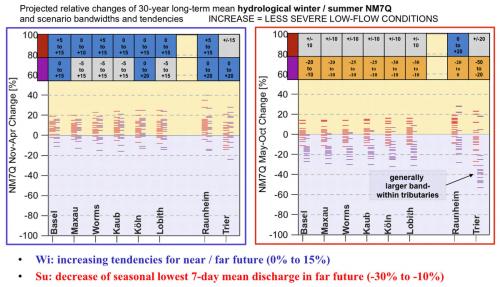
Fig. 10: Relative low flow changes (NM7Q) for hydrological summer and winter for 8 gauging stations. The table at the top contains the results of the scenario bandwidth and tendencies analyses (Fig. 6).
High flow changes
For high flow statistics it can be generally concluded that overall tendencies to increase are projected for Raunheim (Main River), Trier (Moselle River), Köln and Lobith, in particular for the far future. For the near future the tendencies are generally smaller (except for Raunheim) or absent. The scenario bandwidths and thus the (relative) uncertainties become larger going from the near to the far future. In addition the uncertainties (bandwidths) increase going from MHQ to HQ1000. No conclusions are drawn for gauges with a flow regime characterised by summer high flows, like Basel, Maxau, and Worms, since there is limited confidence in the extreme discharge projections.
Limitations
The RheinBlick2050 group compiles much of the currently available climate model results and modelling tools to drive hydrological models and analyse their results to extend our knowledge on the possible direction and quantity of future changes. Nevertheless, there are implicit limitations and constraints to the experiment design (see also the “Reading Guide” on this at the beginning the final project report and information throughout the report, mainly in Chapter 2 and Chapter 3). The study also reveals deficits in current modelling tools and it keeps many aspects open for future investigations. The main philosophy of the project is to integrate as much knowledge as possible into the analysis and to extract as much information for the target measures from it as possible. Hence we keep many climate model runs, although they are partly highly biased which makes bias-corrections necessary. We convert the uncertainty band of the simulations into useful scenario bandwidths and tendencies that are robust between different model runs and that can easily be interpreted by potential users.
Due to temporal constraints important aspects of the climate change impact question are not covered by the study and report. Water temperature is a key variable for example in ecology, for water quality issues, and economy (e.g. energy production). Morpho- hydrodynamic and land cover models are not integrated in the model chain. Extreme discharge values have to be interpreted with care since the hydrodynamic damping of extreme floods due to overtopping of dikes is not taken into account. Cause and effect relationships linking exact physical system changes (e.g. changes in precipitation characteristics, snow pack, glaciers, lakes) with the hydrological response in the Rhine River system are only partly explored and have to be treated in more detail in future studies.
Synopsis
We quantify ranges and directions of change. The discharge analyses are intended to foster (a) the ongoing discussion on the necessity of adaptation and (b) the dimension of the vulnerability of ecological and economical systems dependent on the Rhine River. However, these values clearly are not the one and only solution to the “climate problem”, if there is one.
For more complete information please refer to the final project report.
Publications
Görgen, K., Beersma, J., Brahmer, G., Buiteveld, H., Carambia, M., de Keizer, O., Krahe, P., Nilson, E., Lammersen, R., Perrin, C. and Volken, D. (2010) Assessment of Climate Change Impacts on Discharge in the Rhine River Basin: Results of the RheinBlick2050 Project, CHR report, I-23, 229 pp., Lelystad, ISBN 978-90-70980-35-1. (final report, about 23.8 MB)
Conference proceedings and presentations have not been listed yet.
Downloads
Additional versioned and documented material like datasets and visualisations may be made available here in the future.
* The acronym “RheinBlick2050” combines the “Rhine” River name with the German verb “blicken”, which translates into to “look”; i.e. we try “to look into the future of the Rhine River” with a temporal focus on the near future up to the year 2050.
Author: K. Görgen (CRP-GL / EVA / GEOSAT).