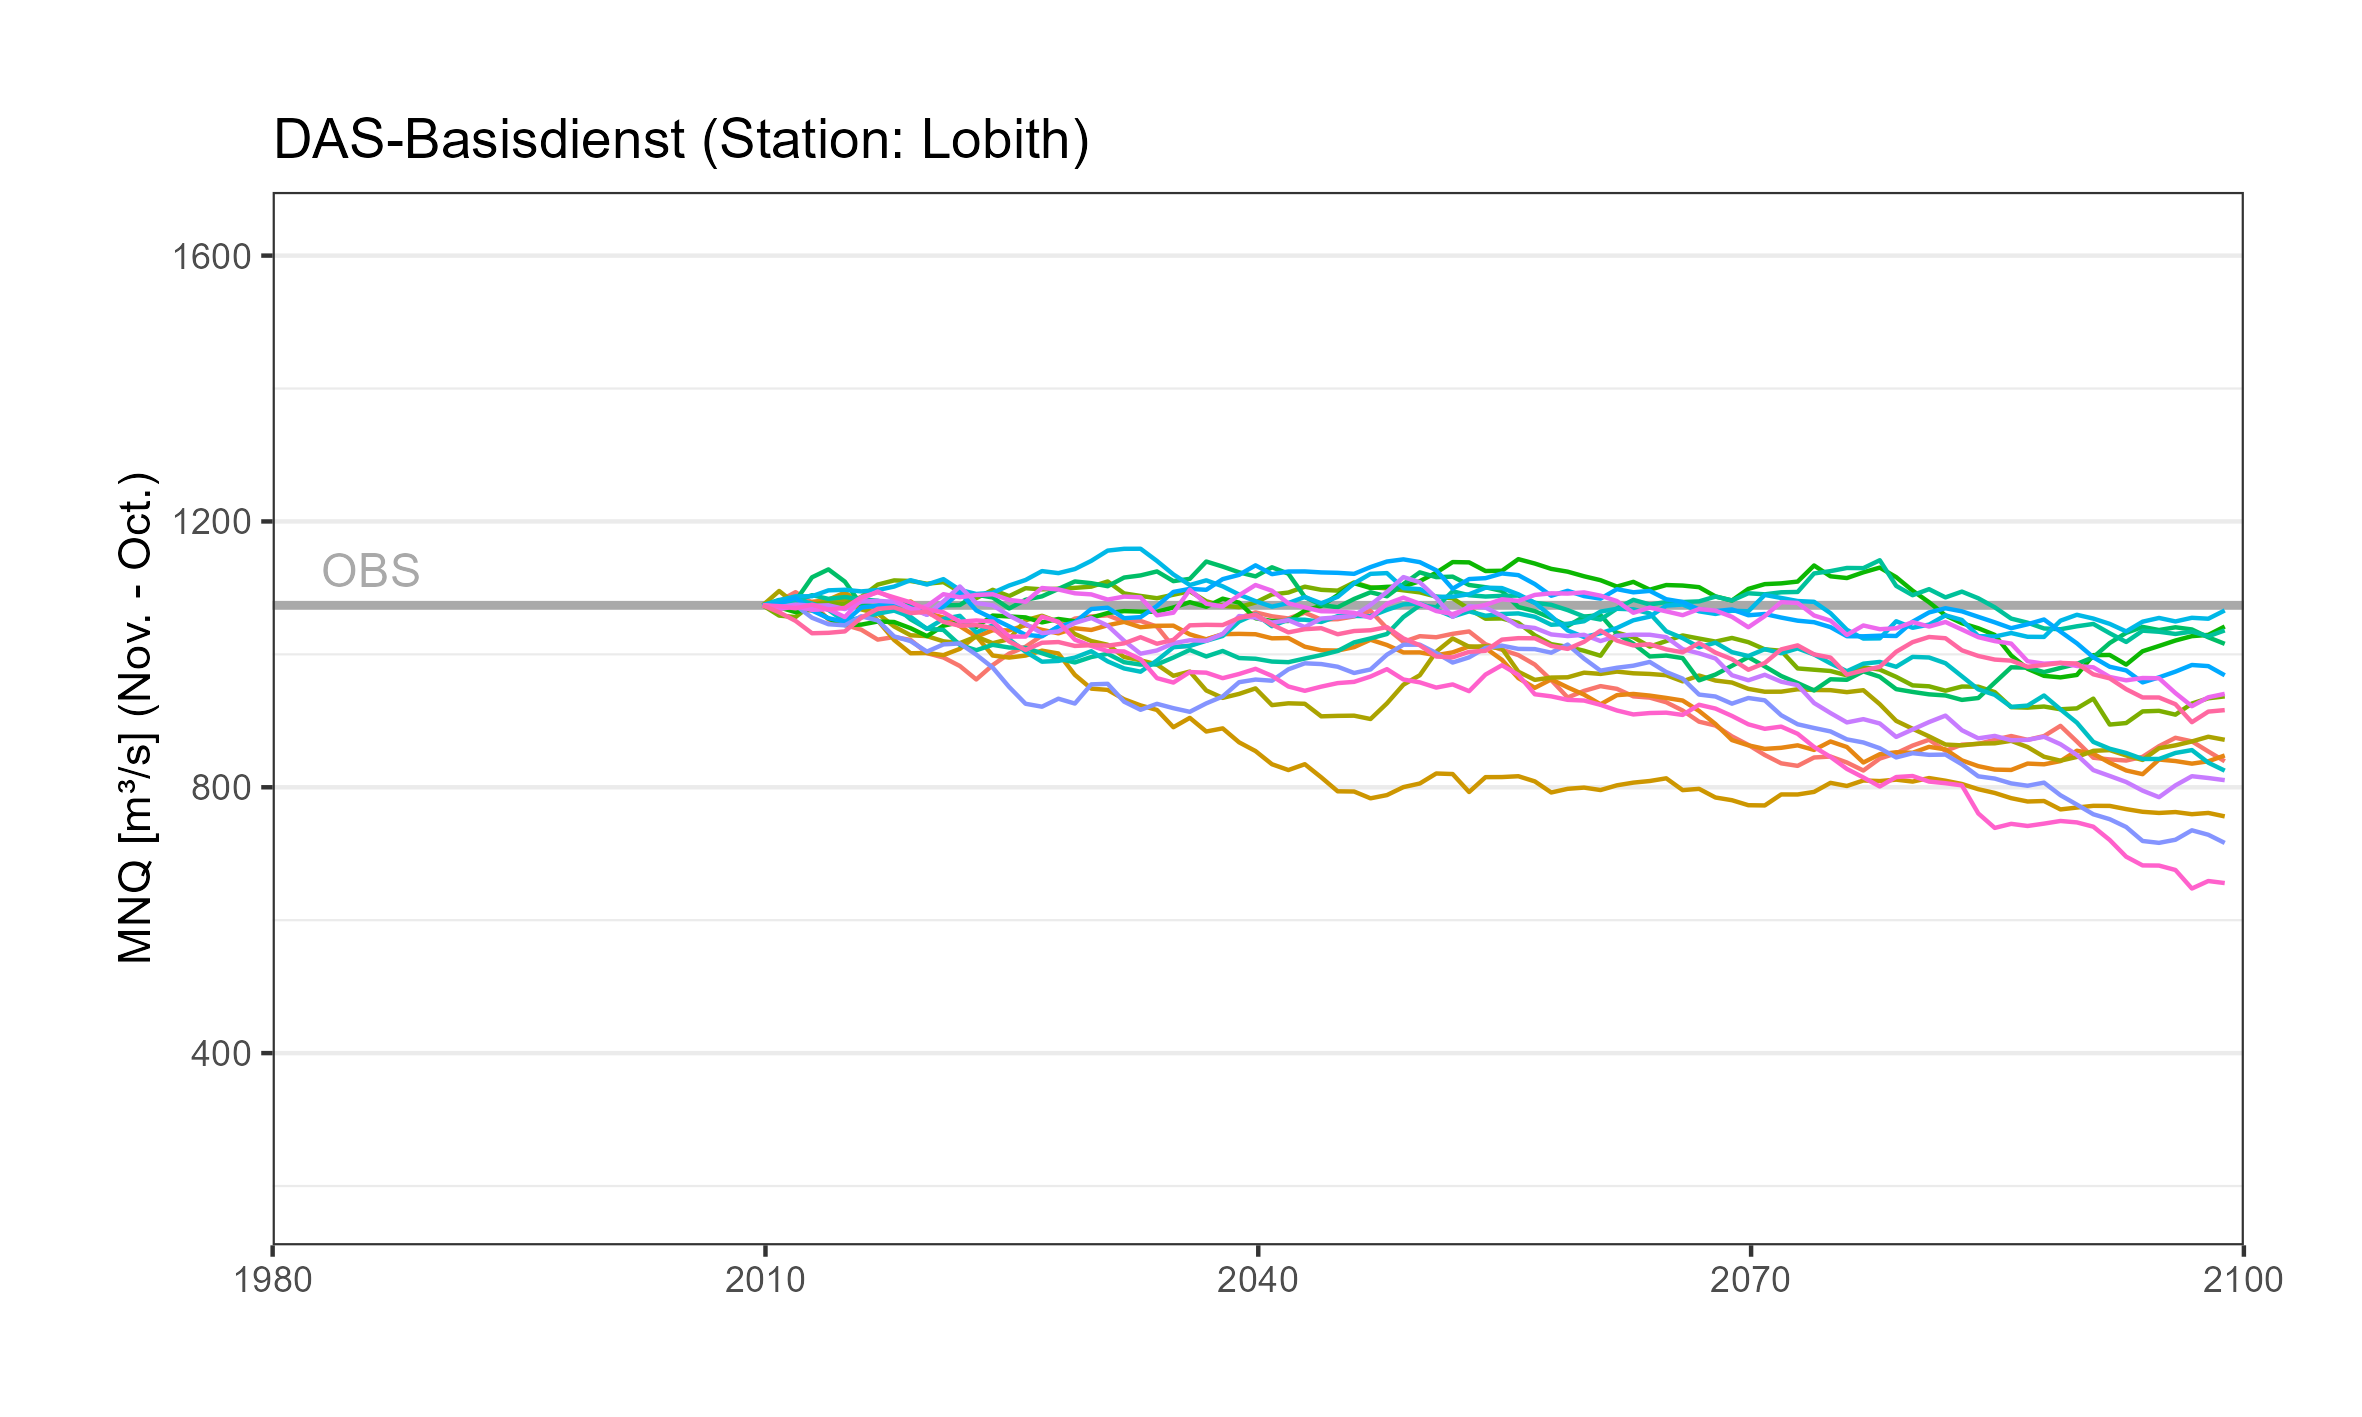
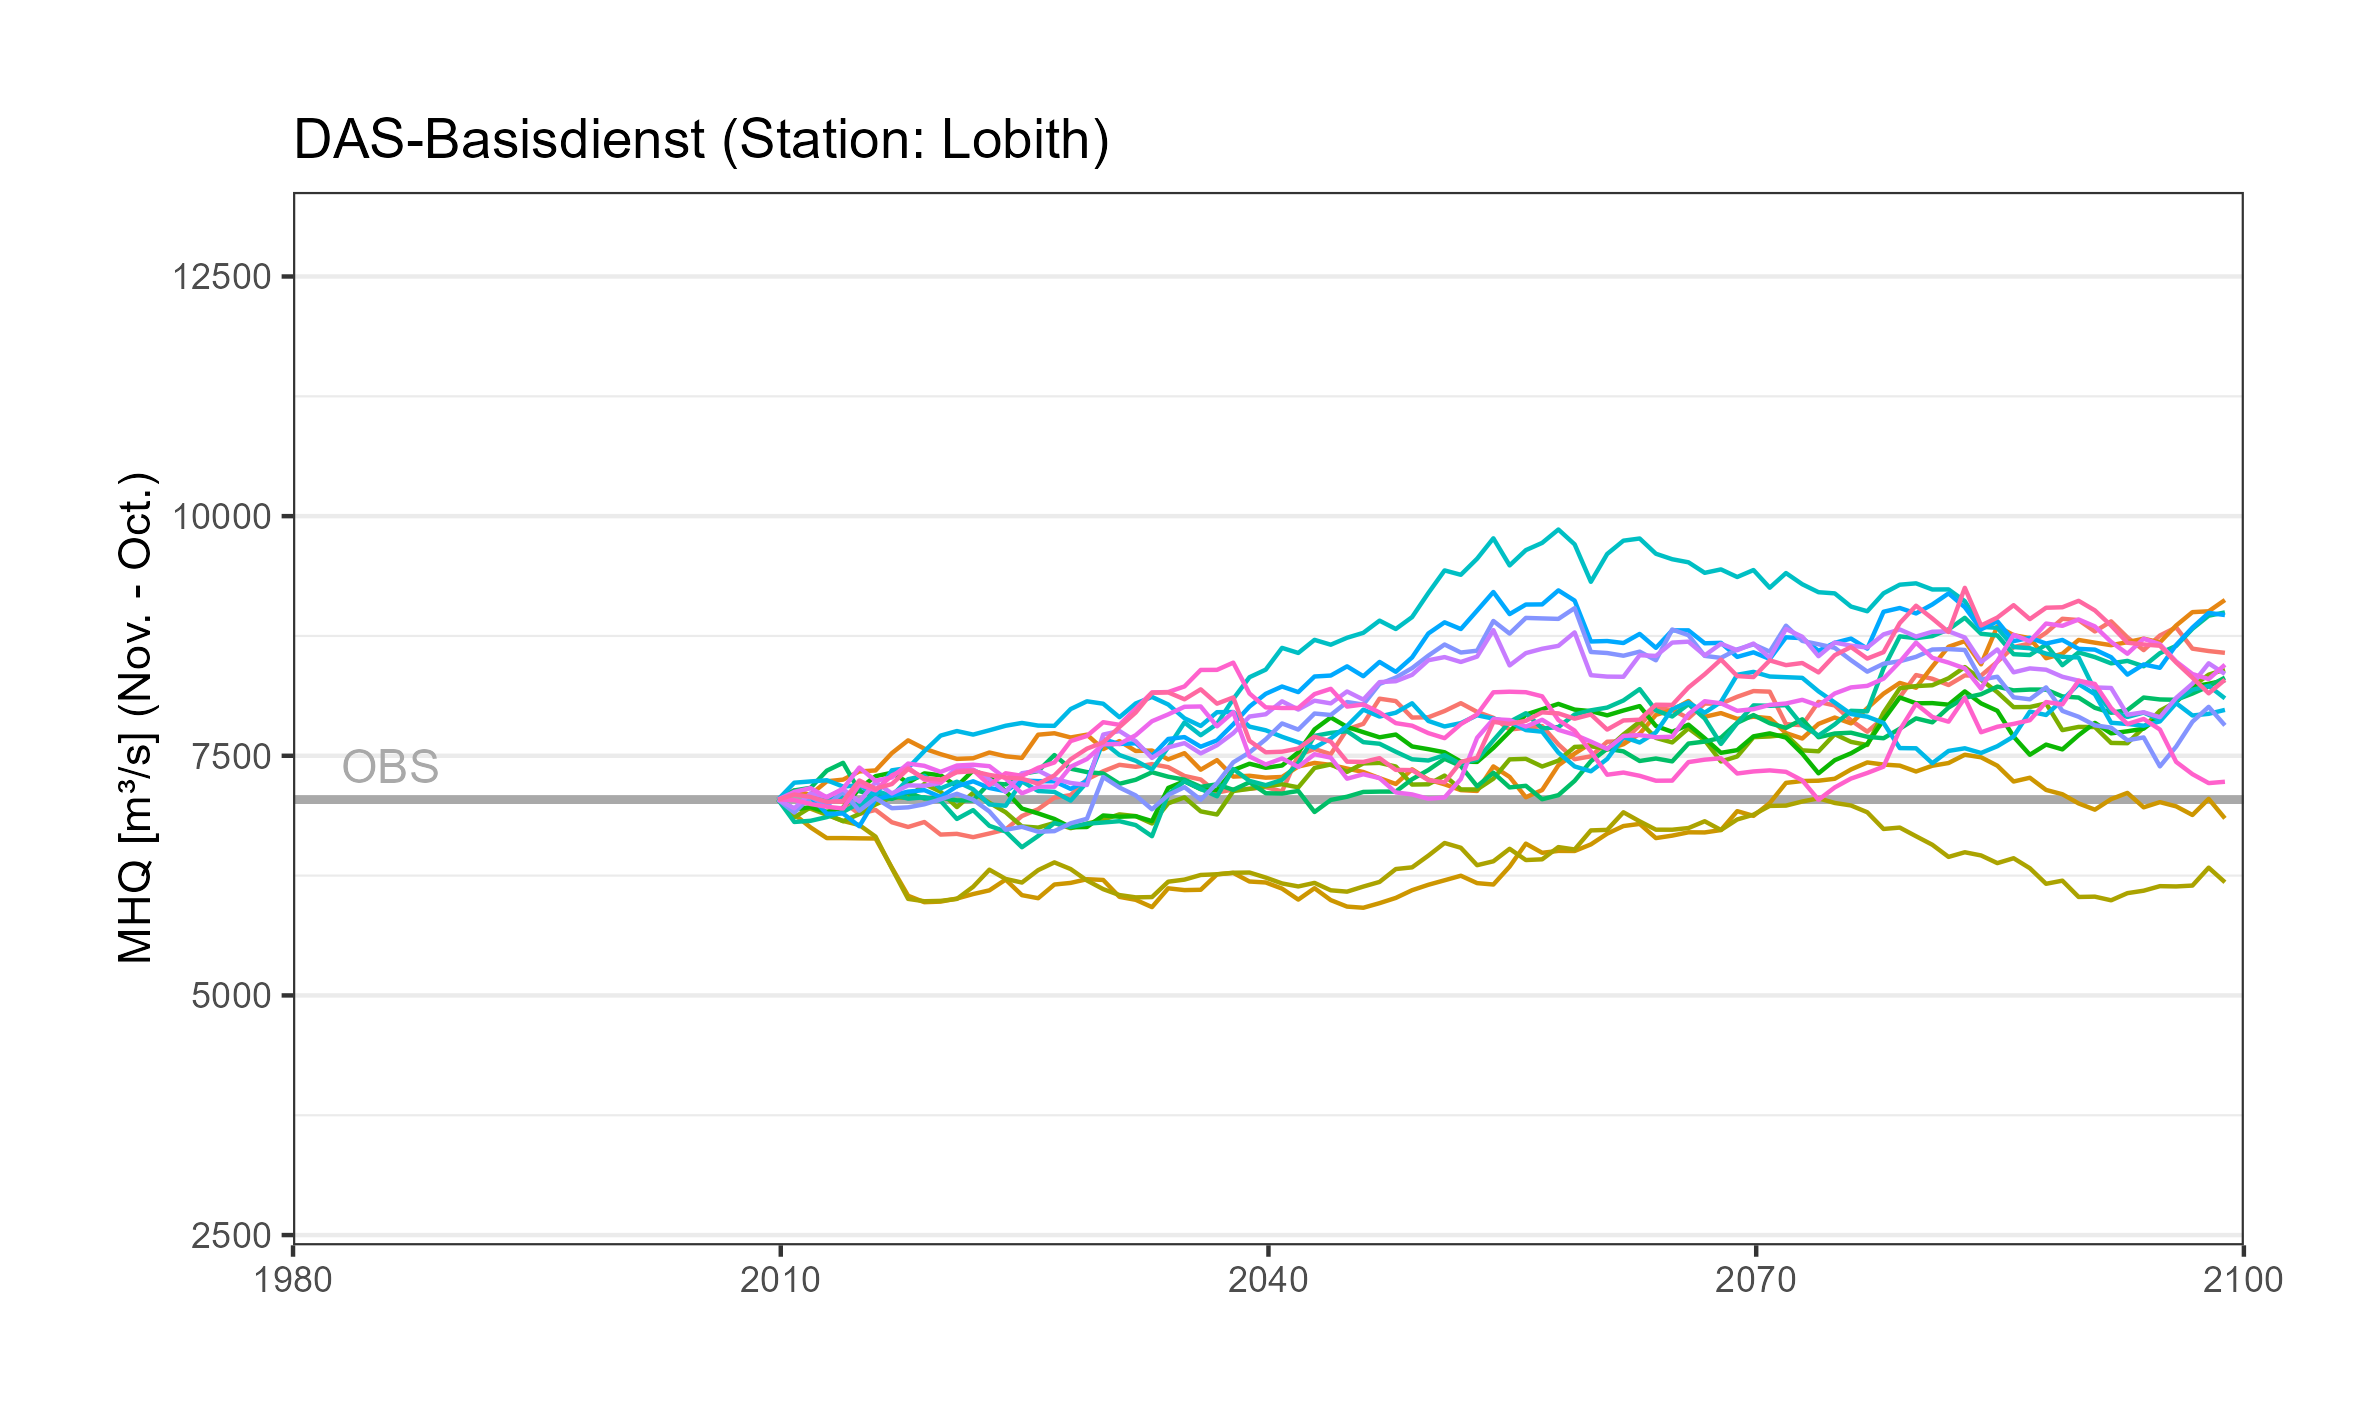
Location
Location name
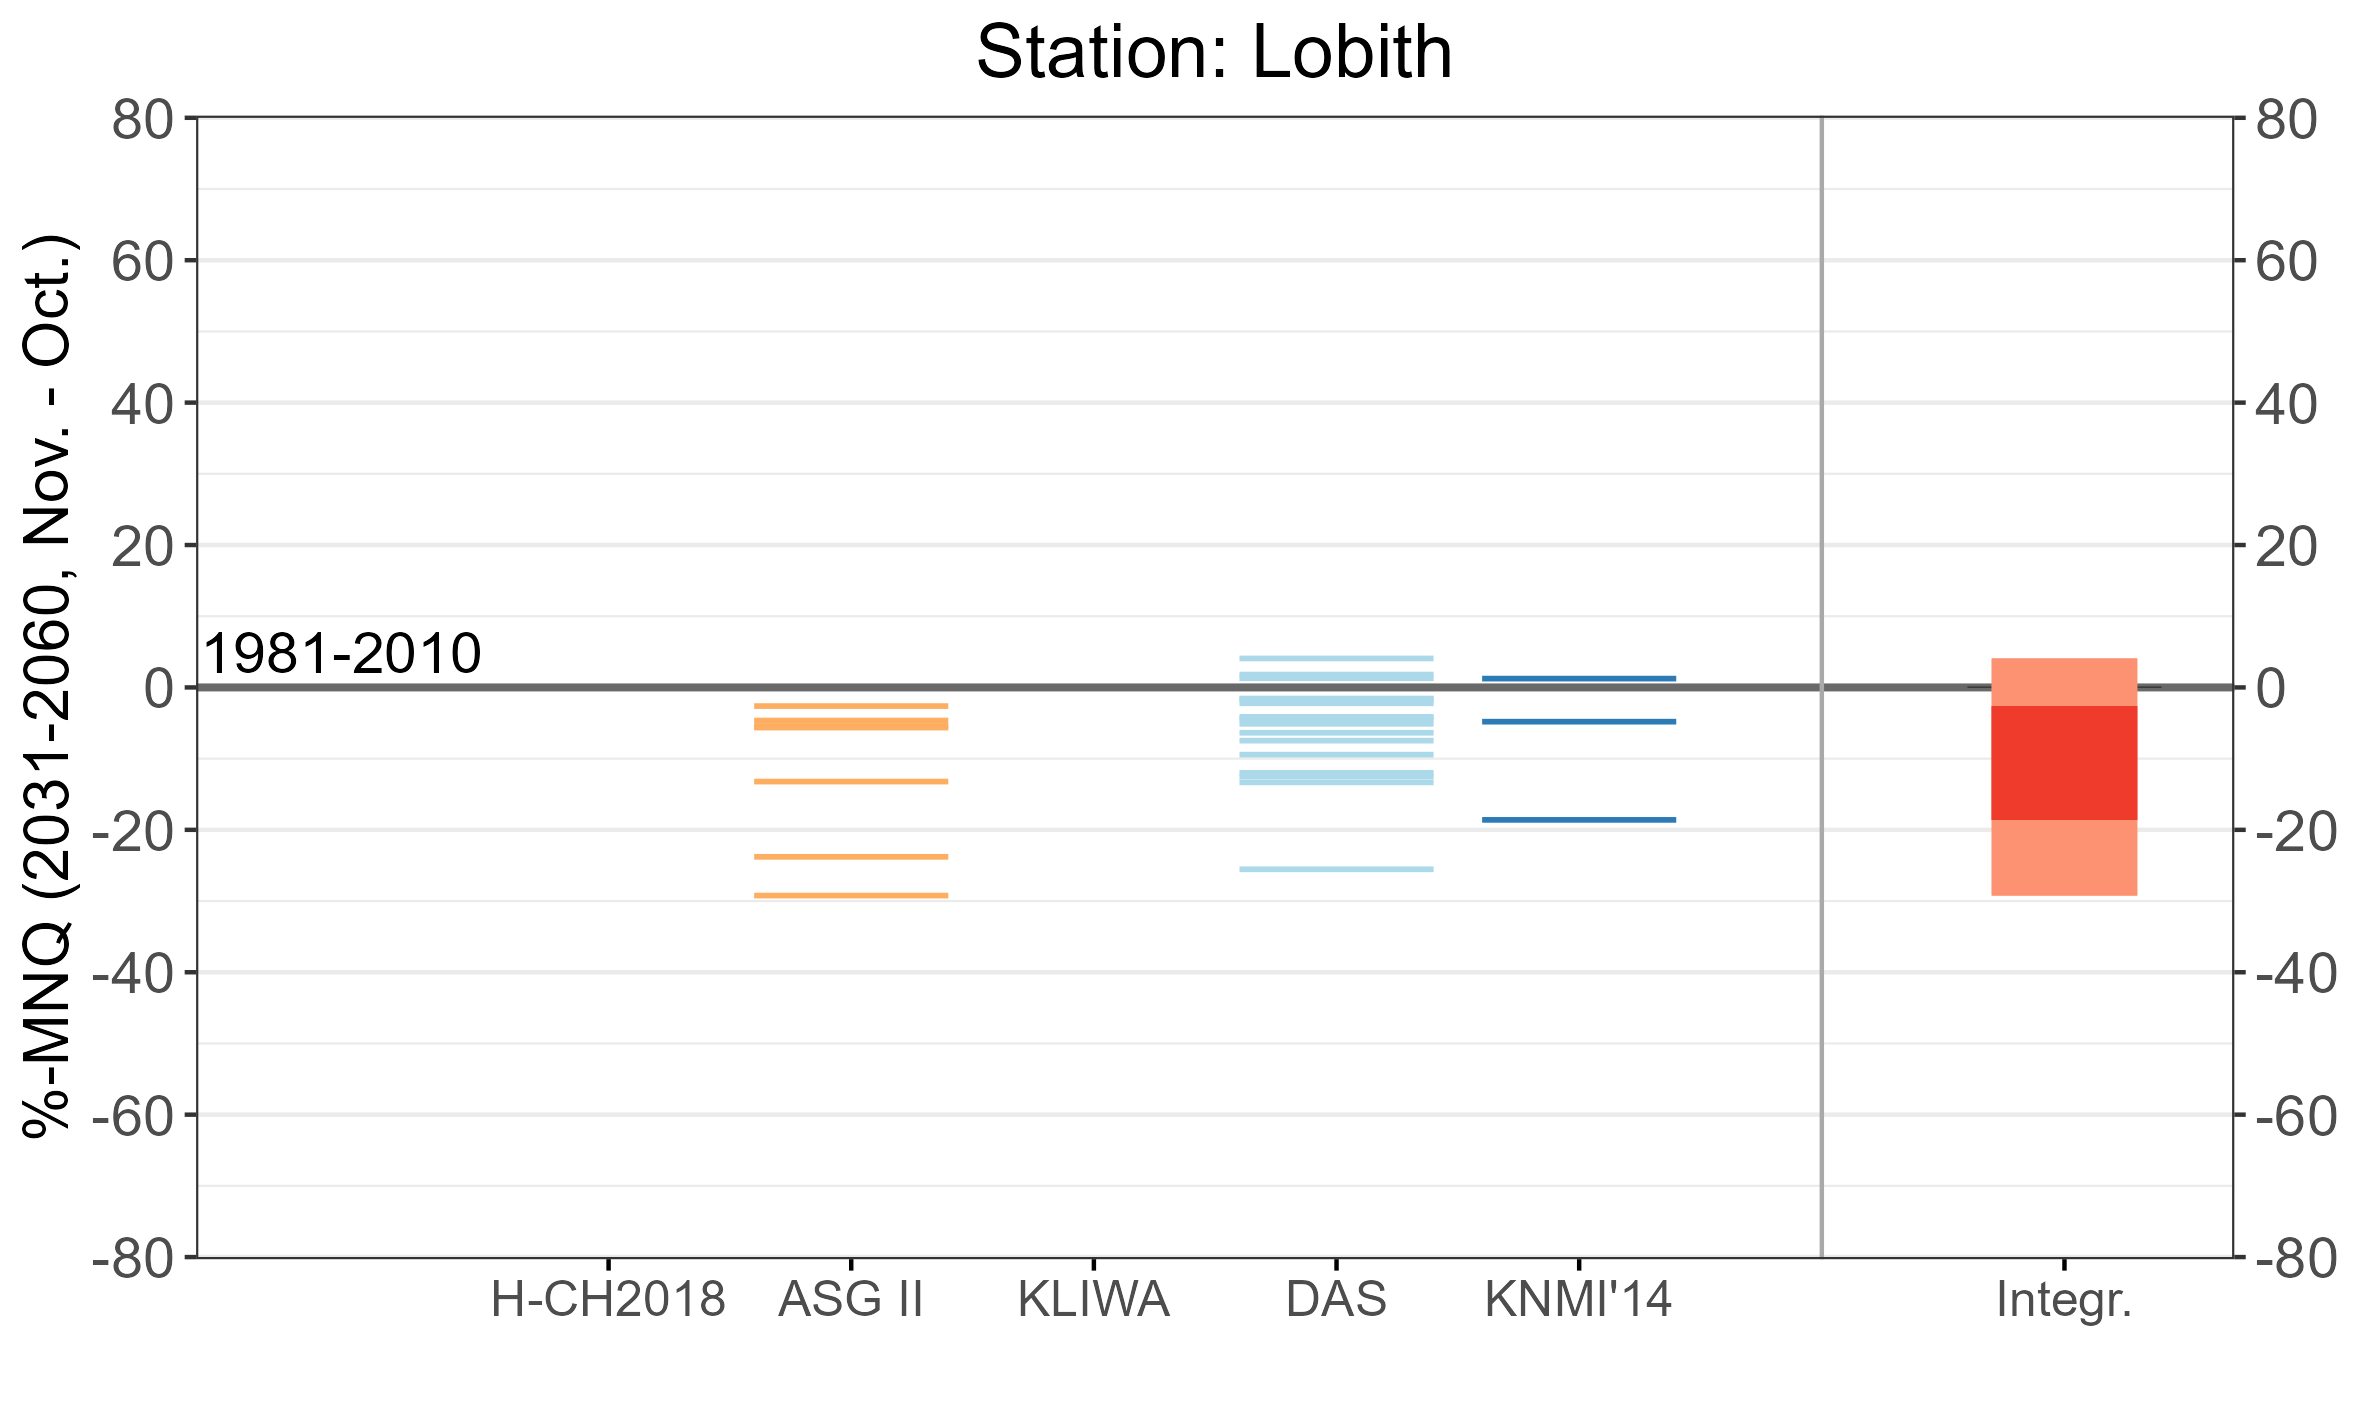
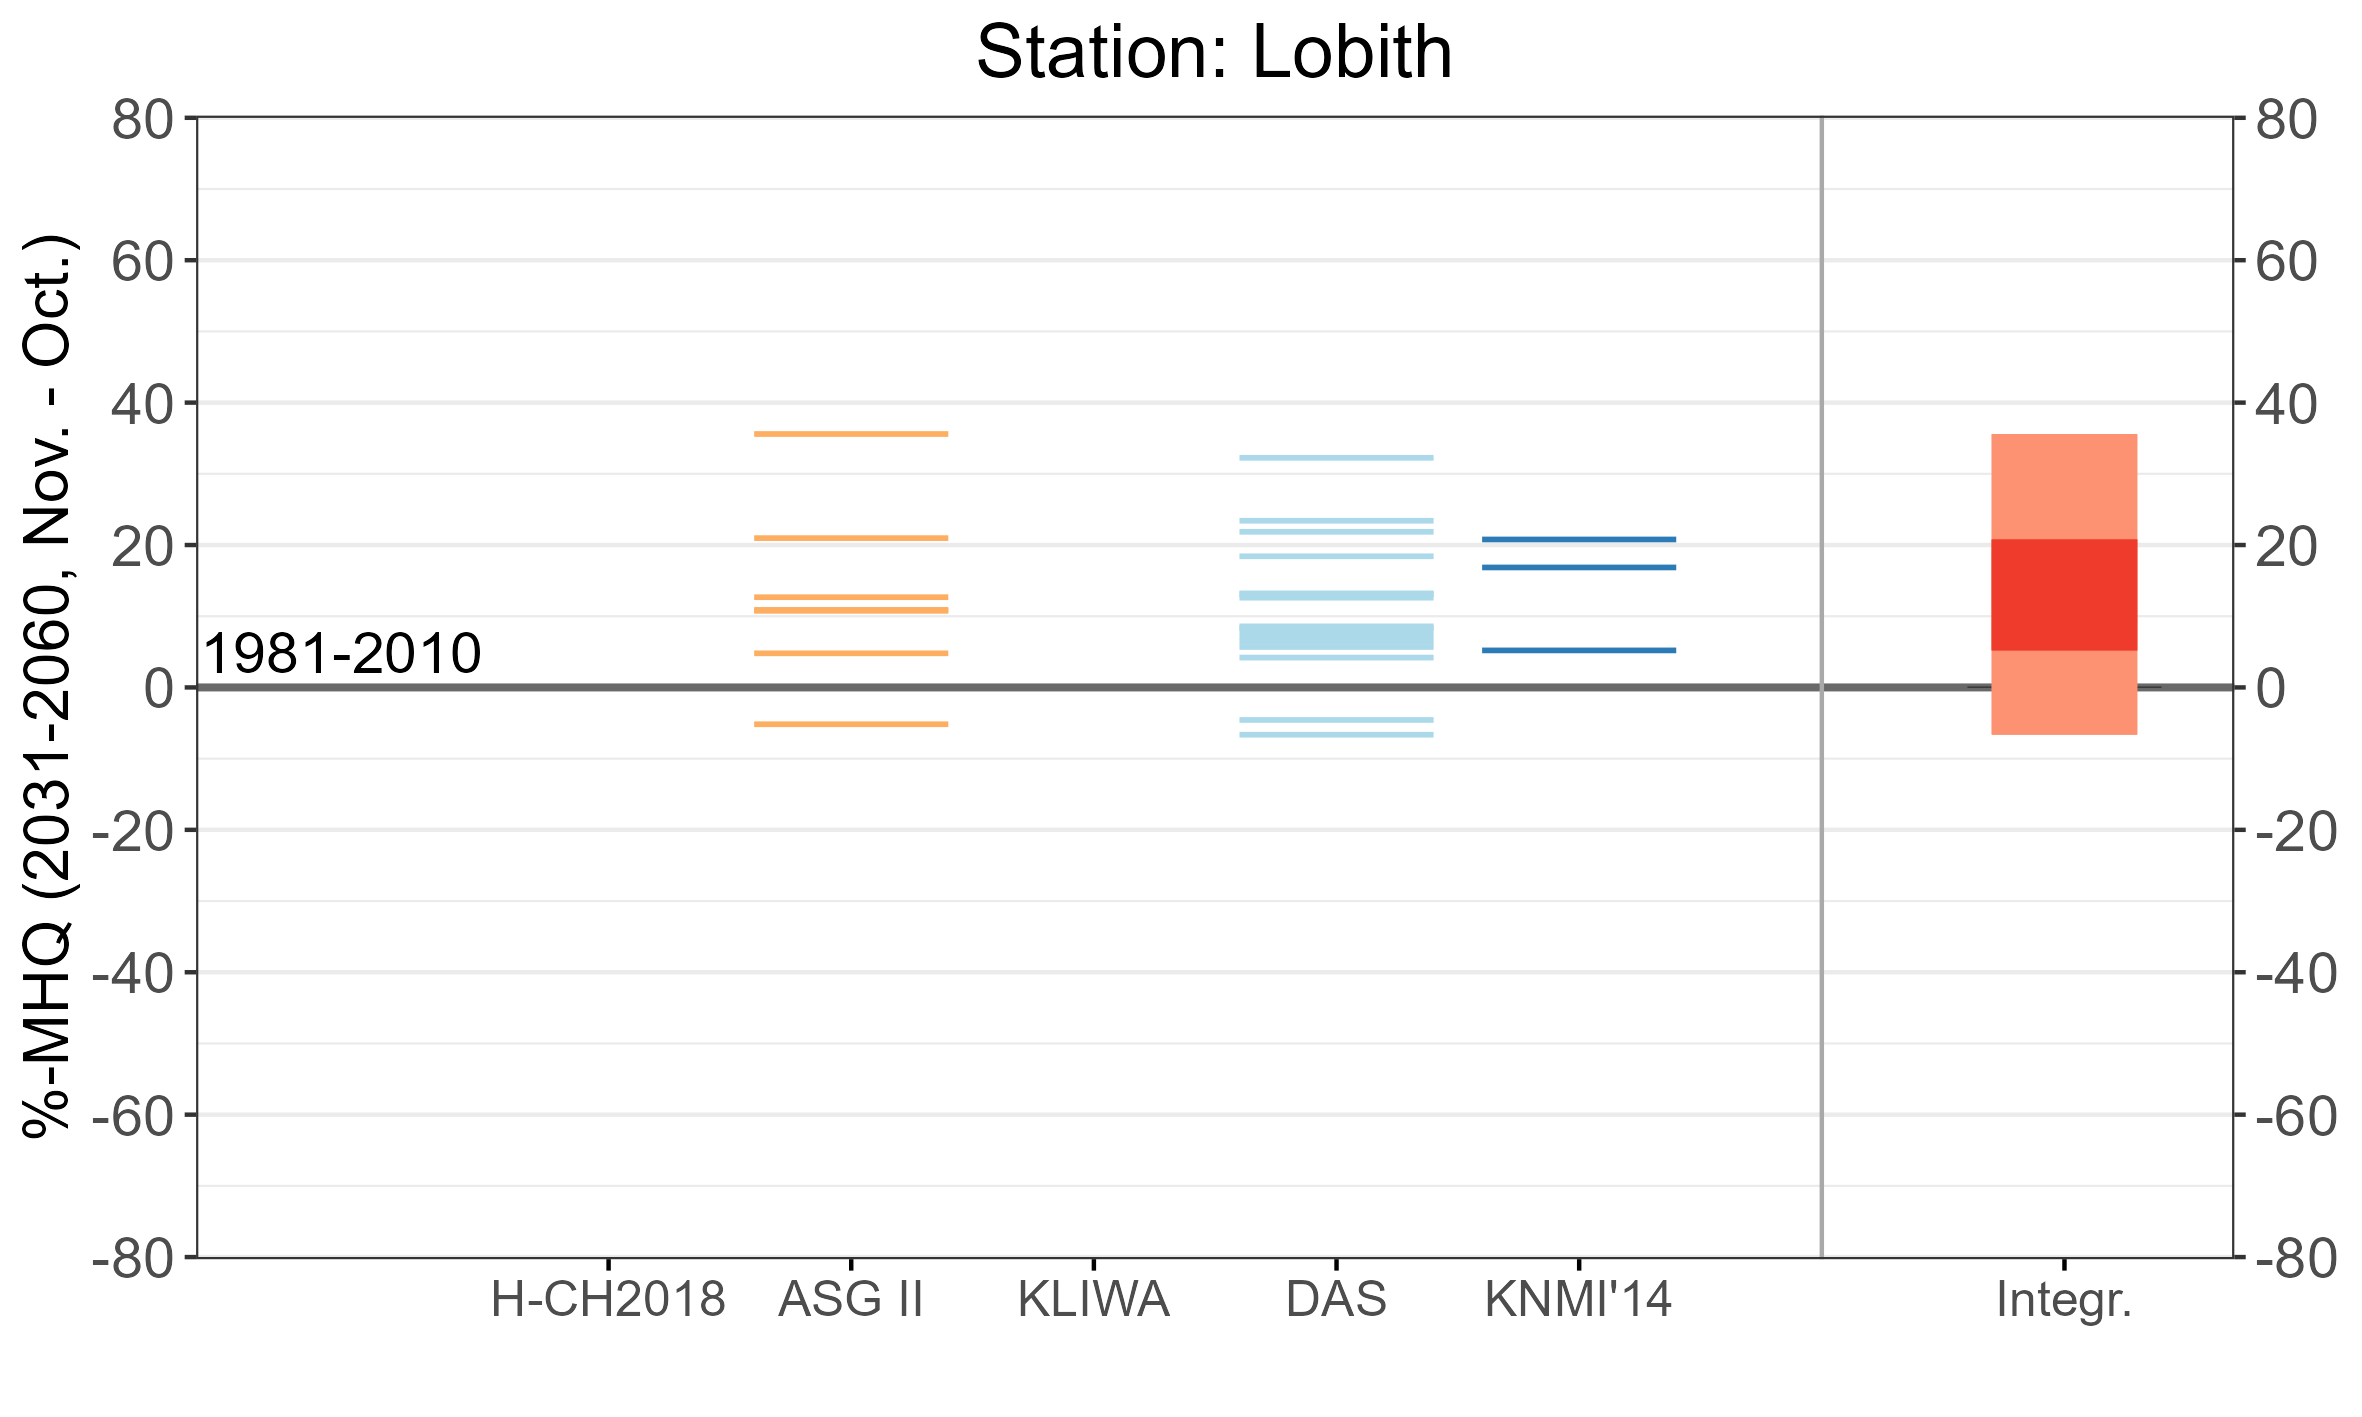
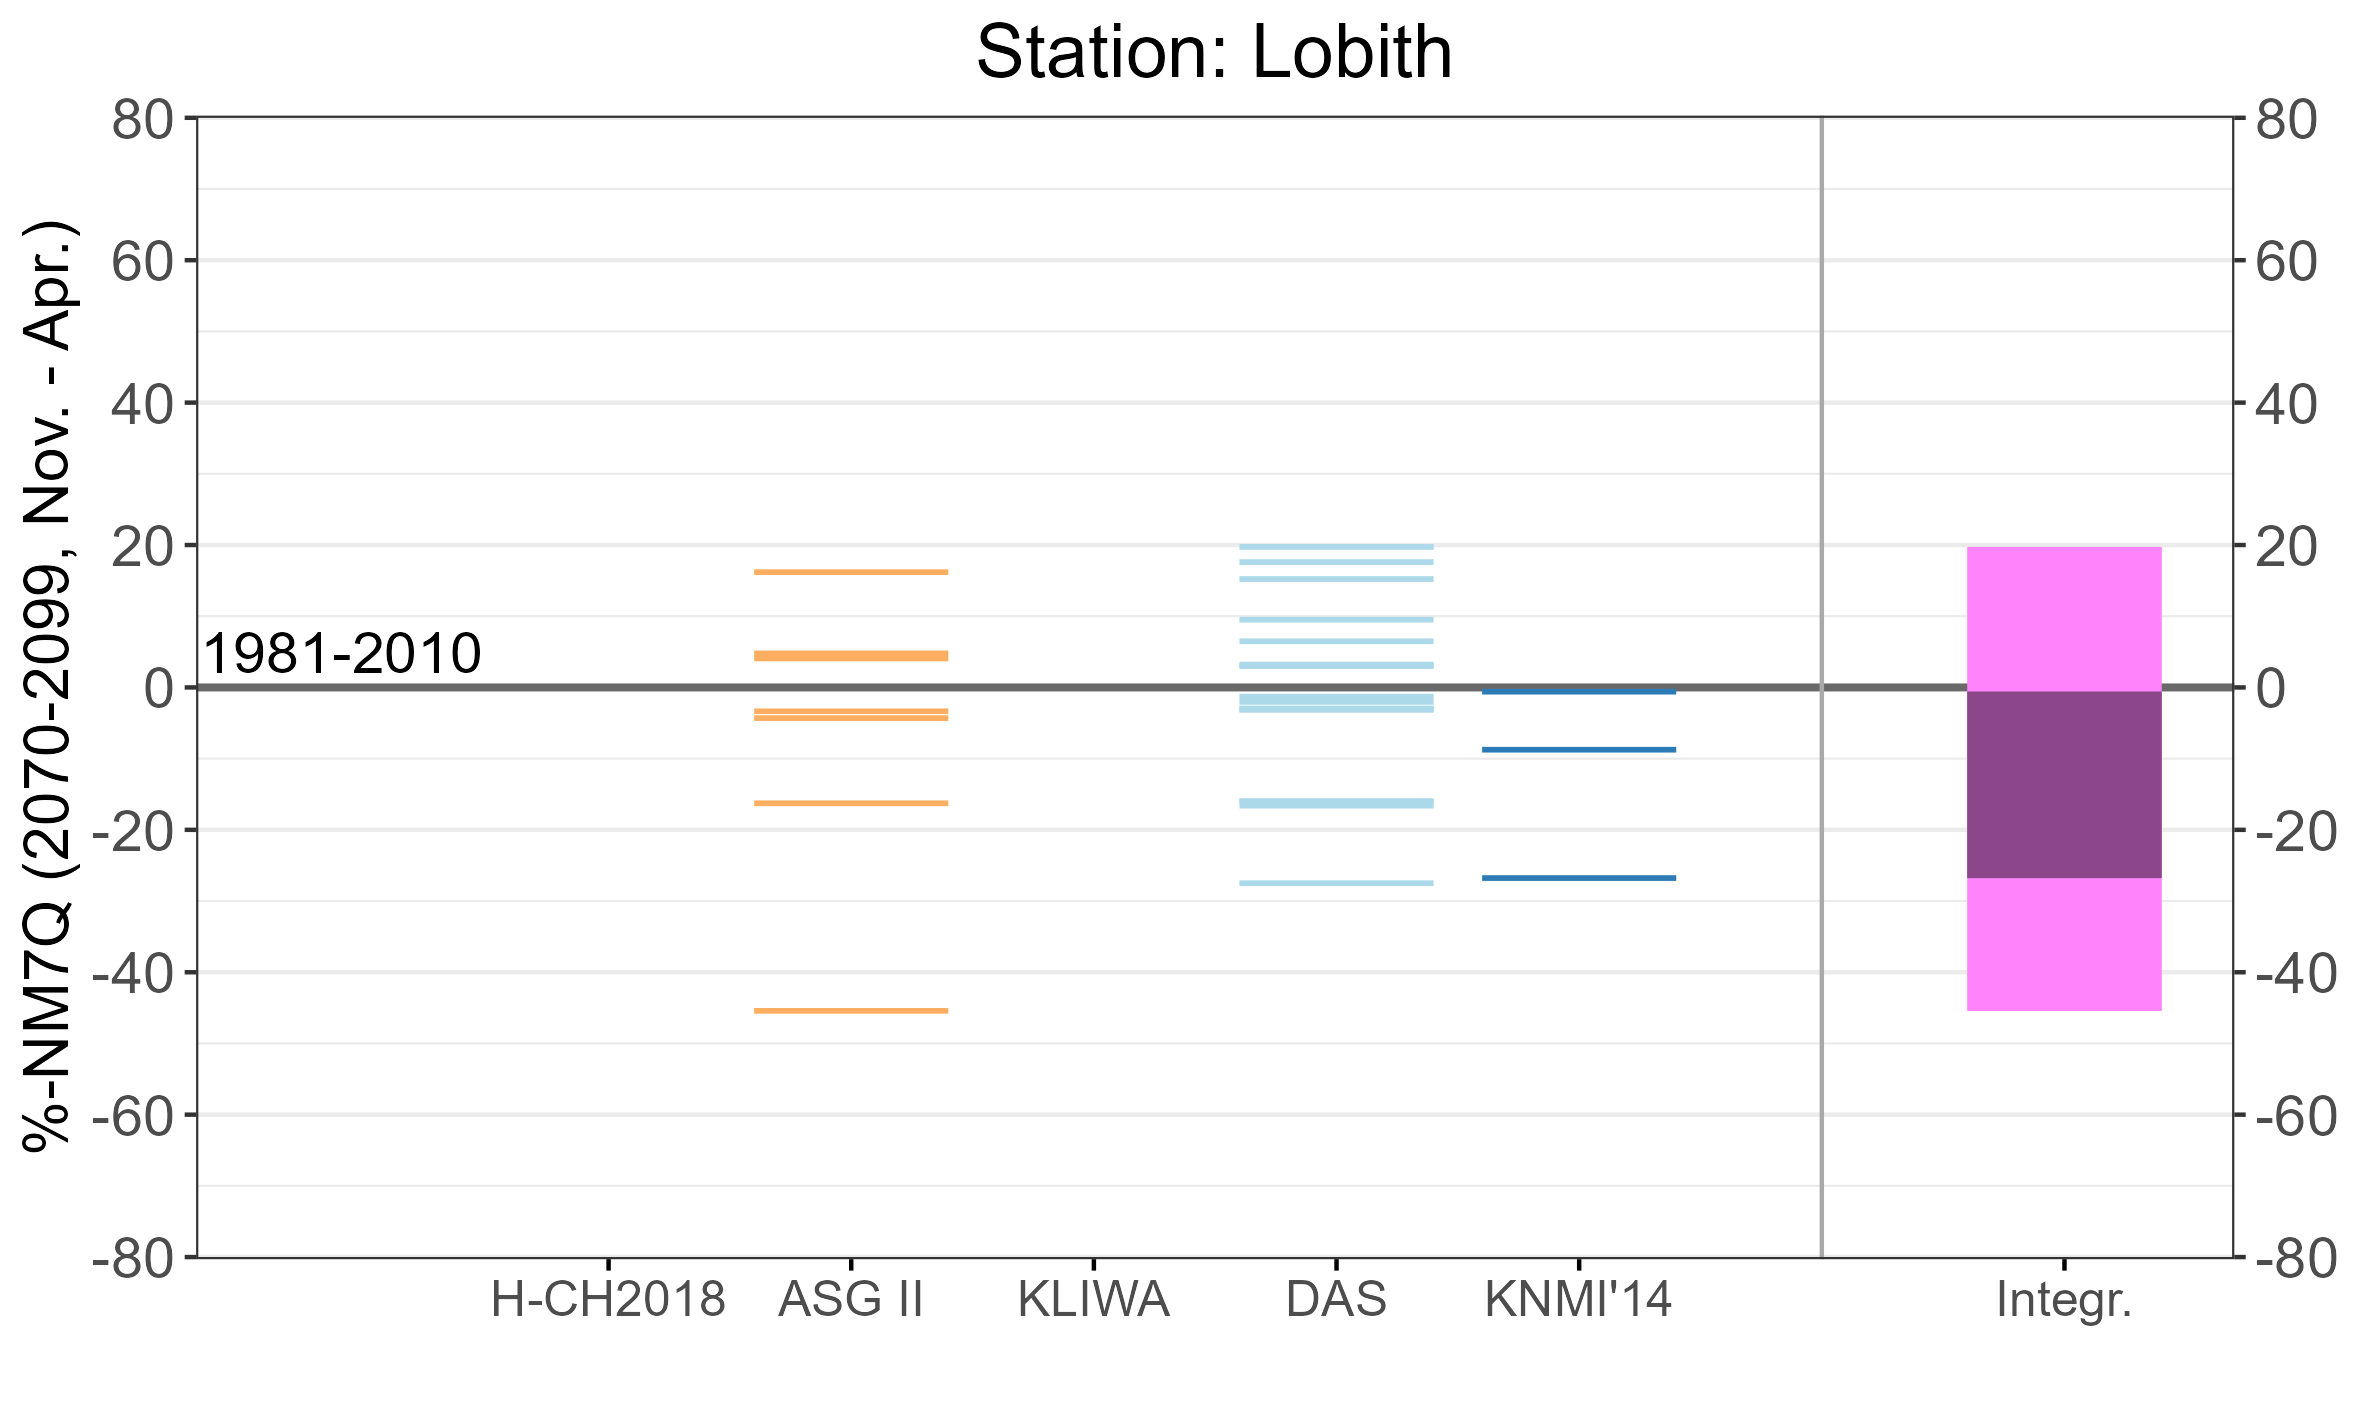
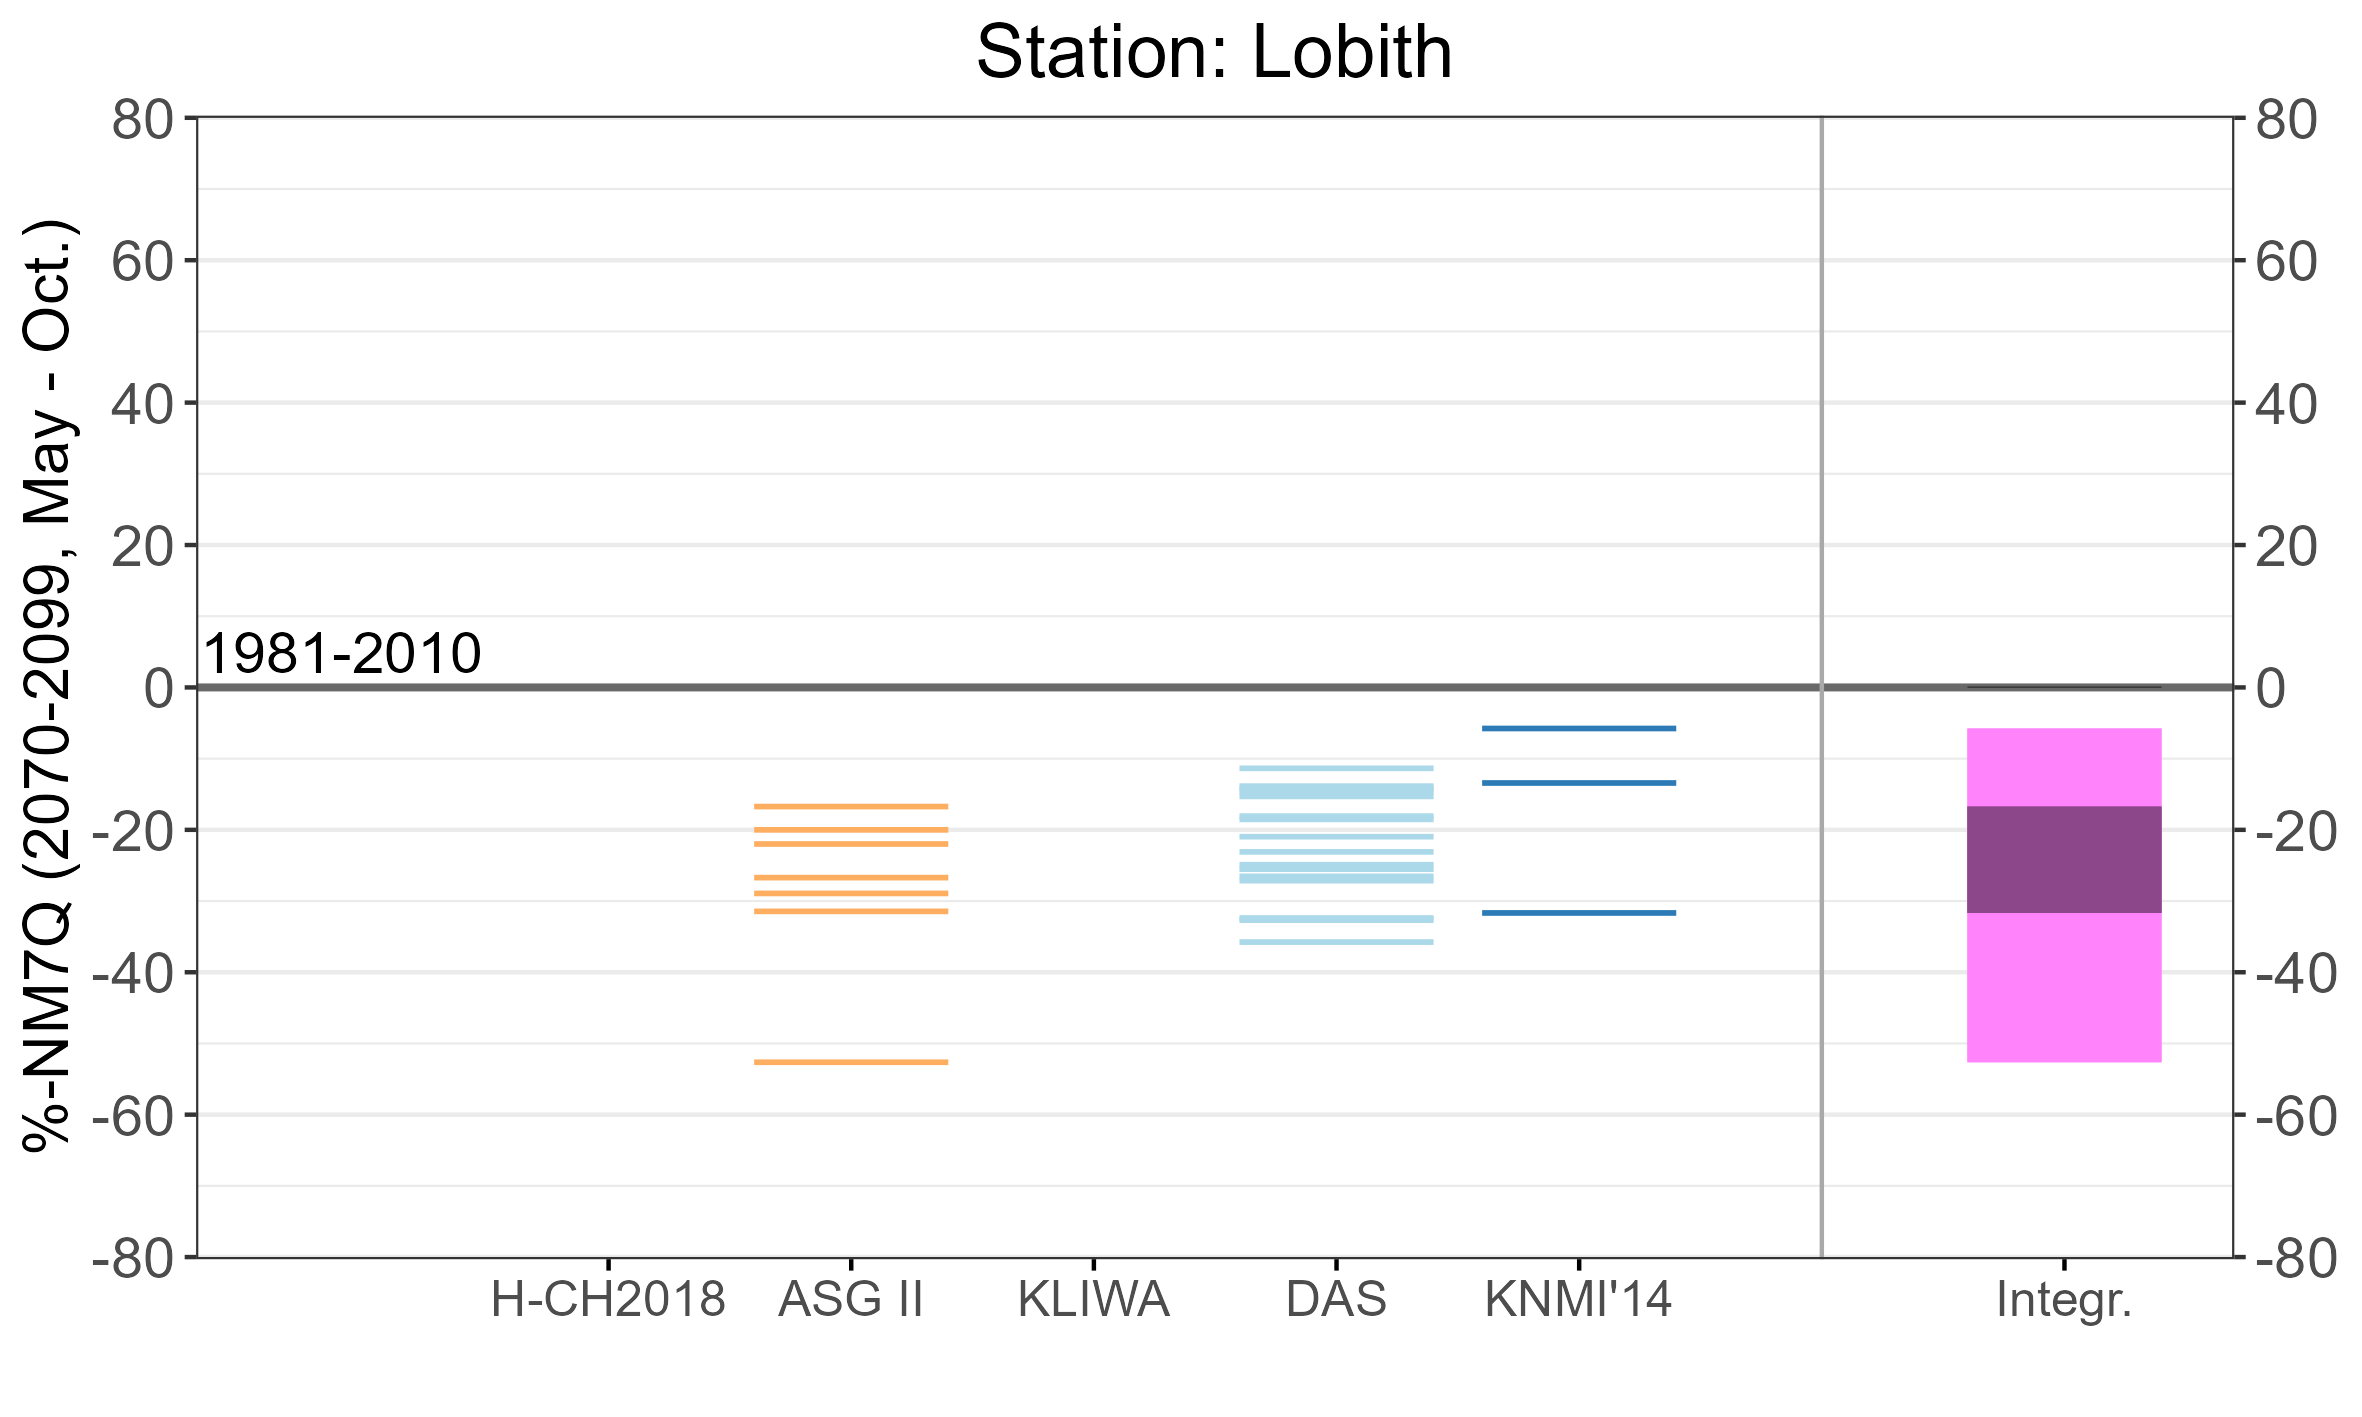
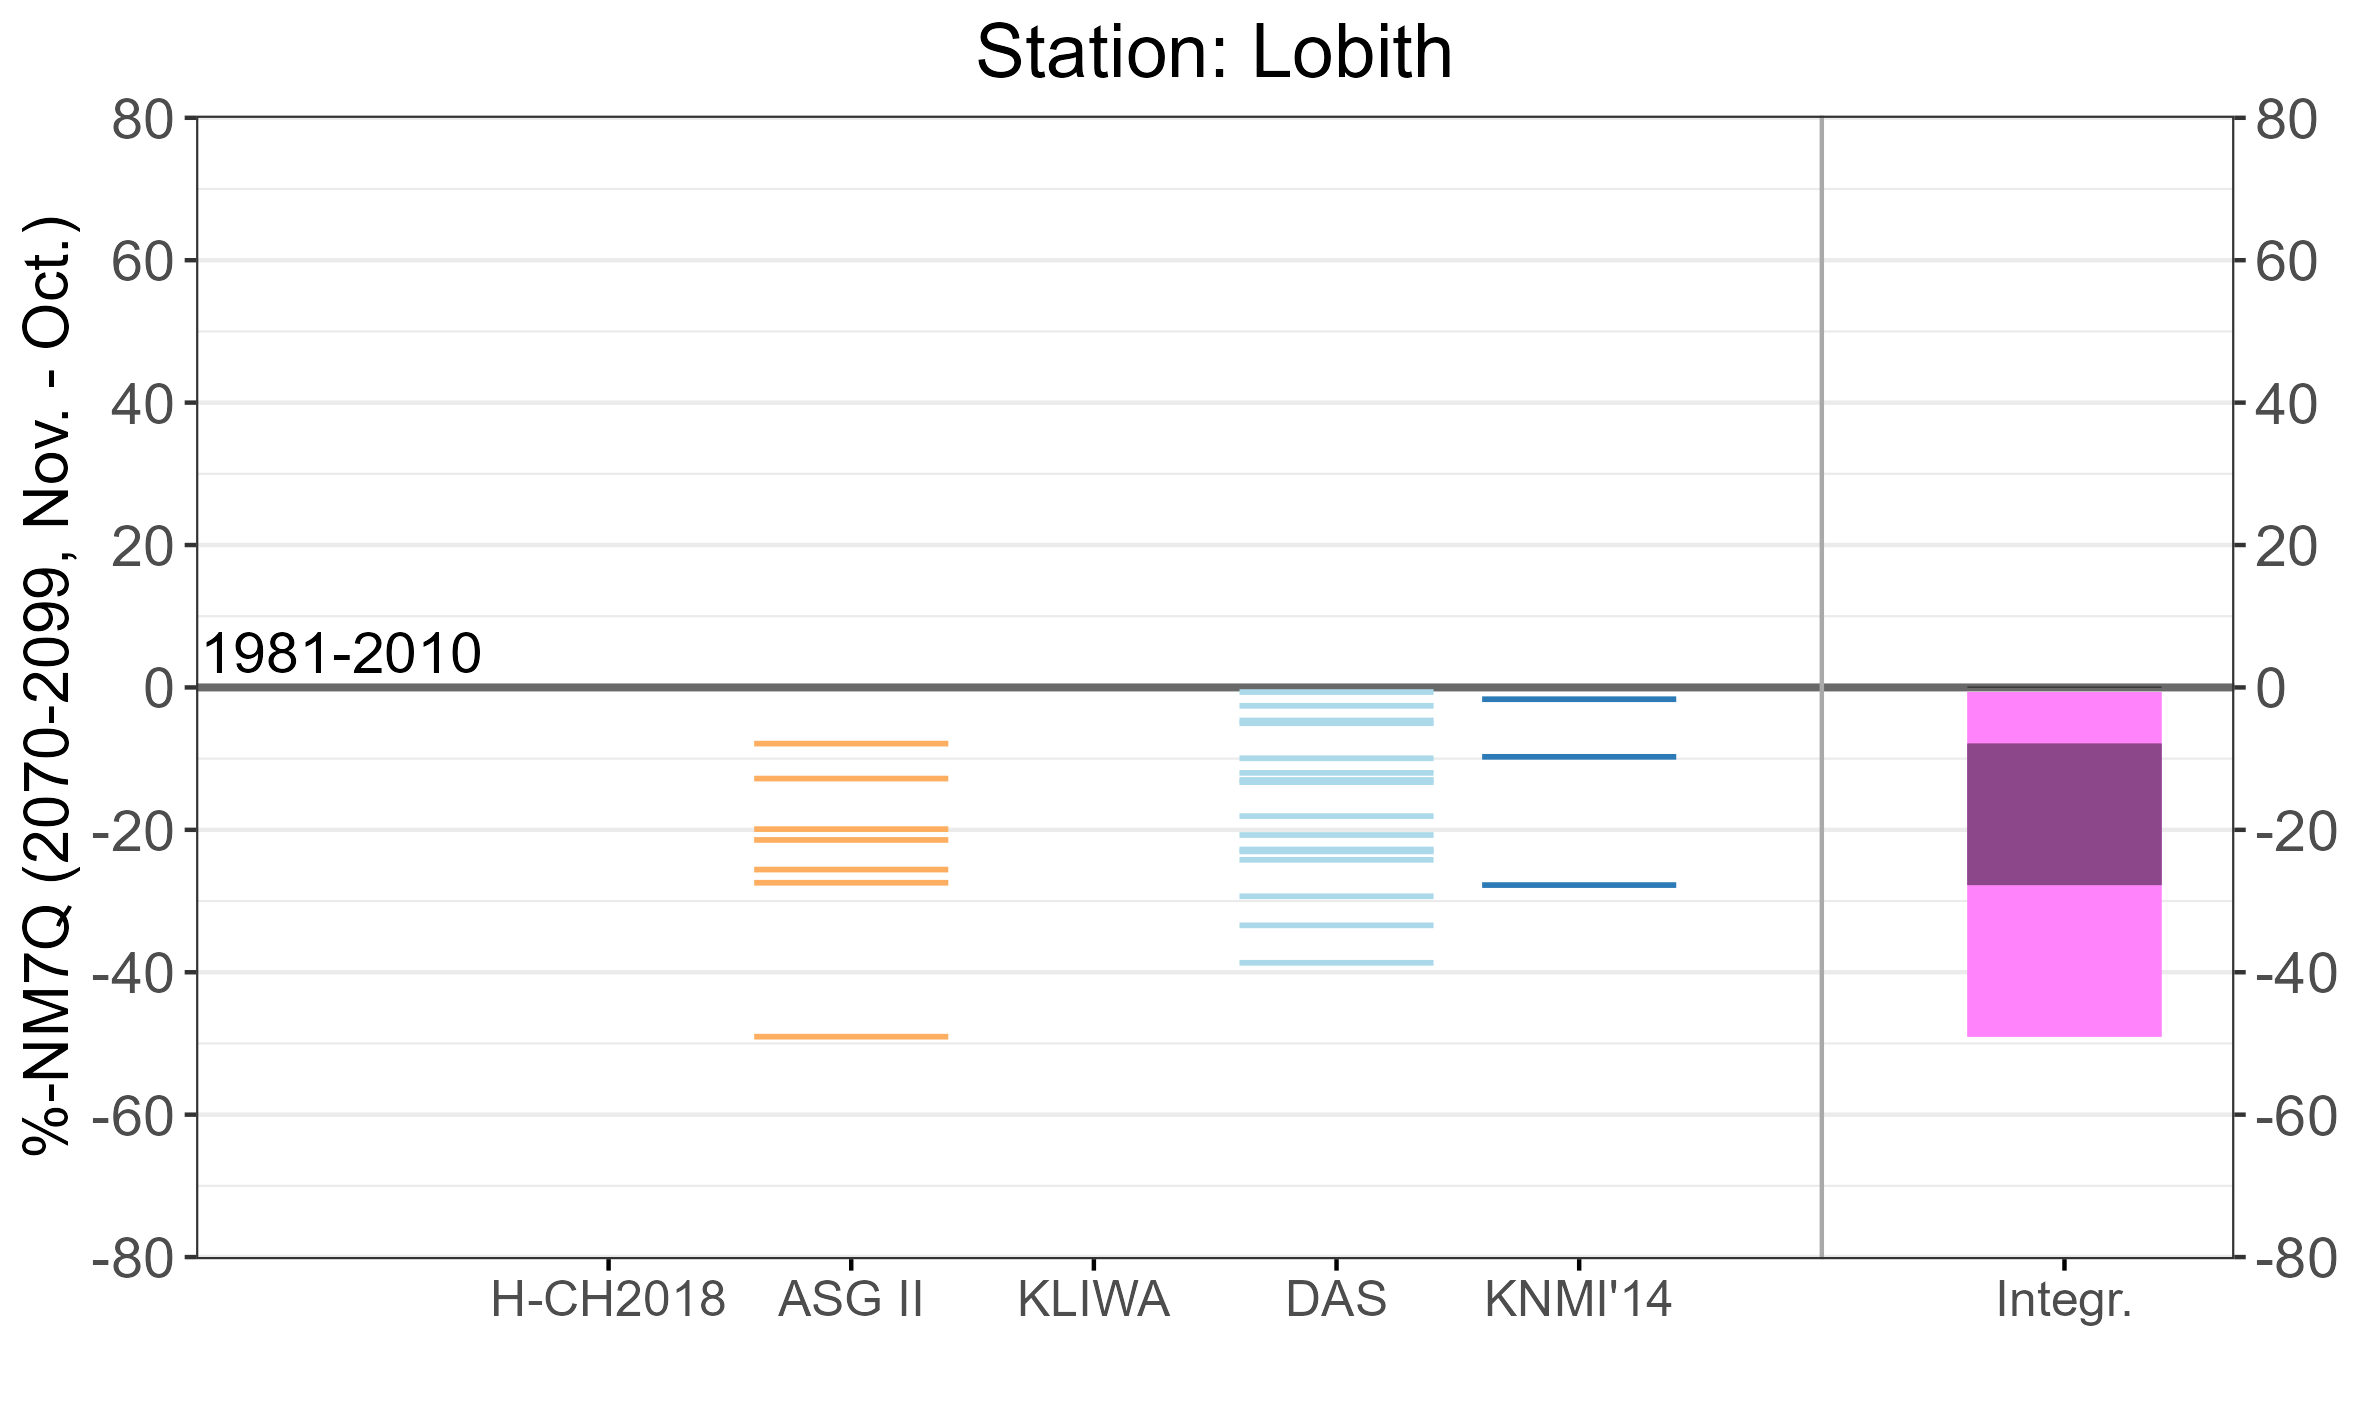
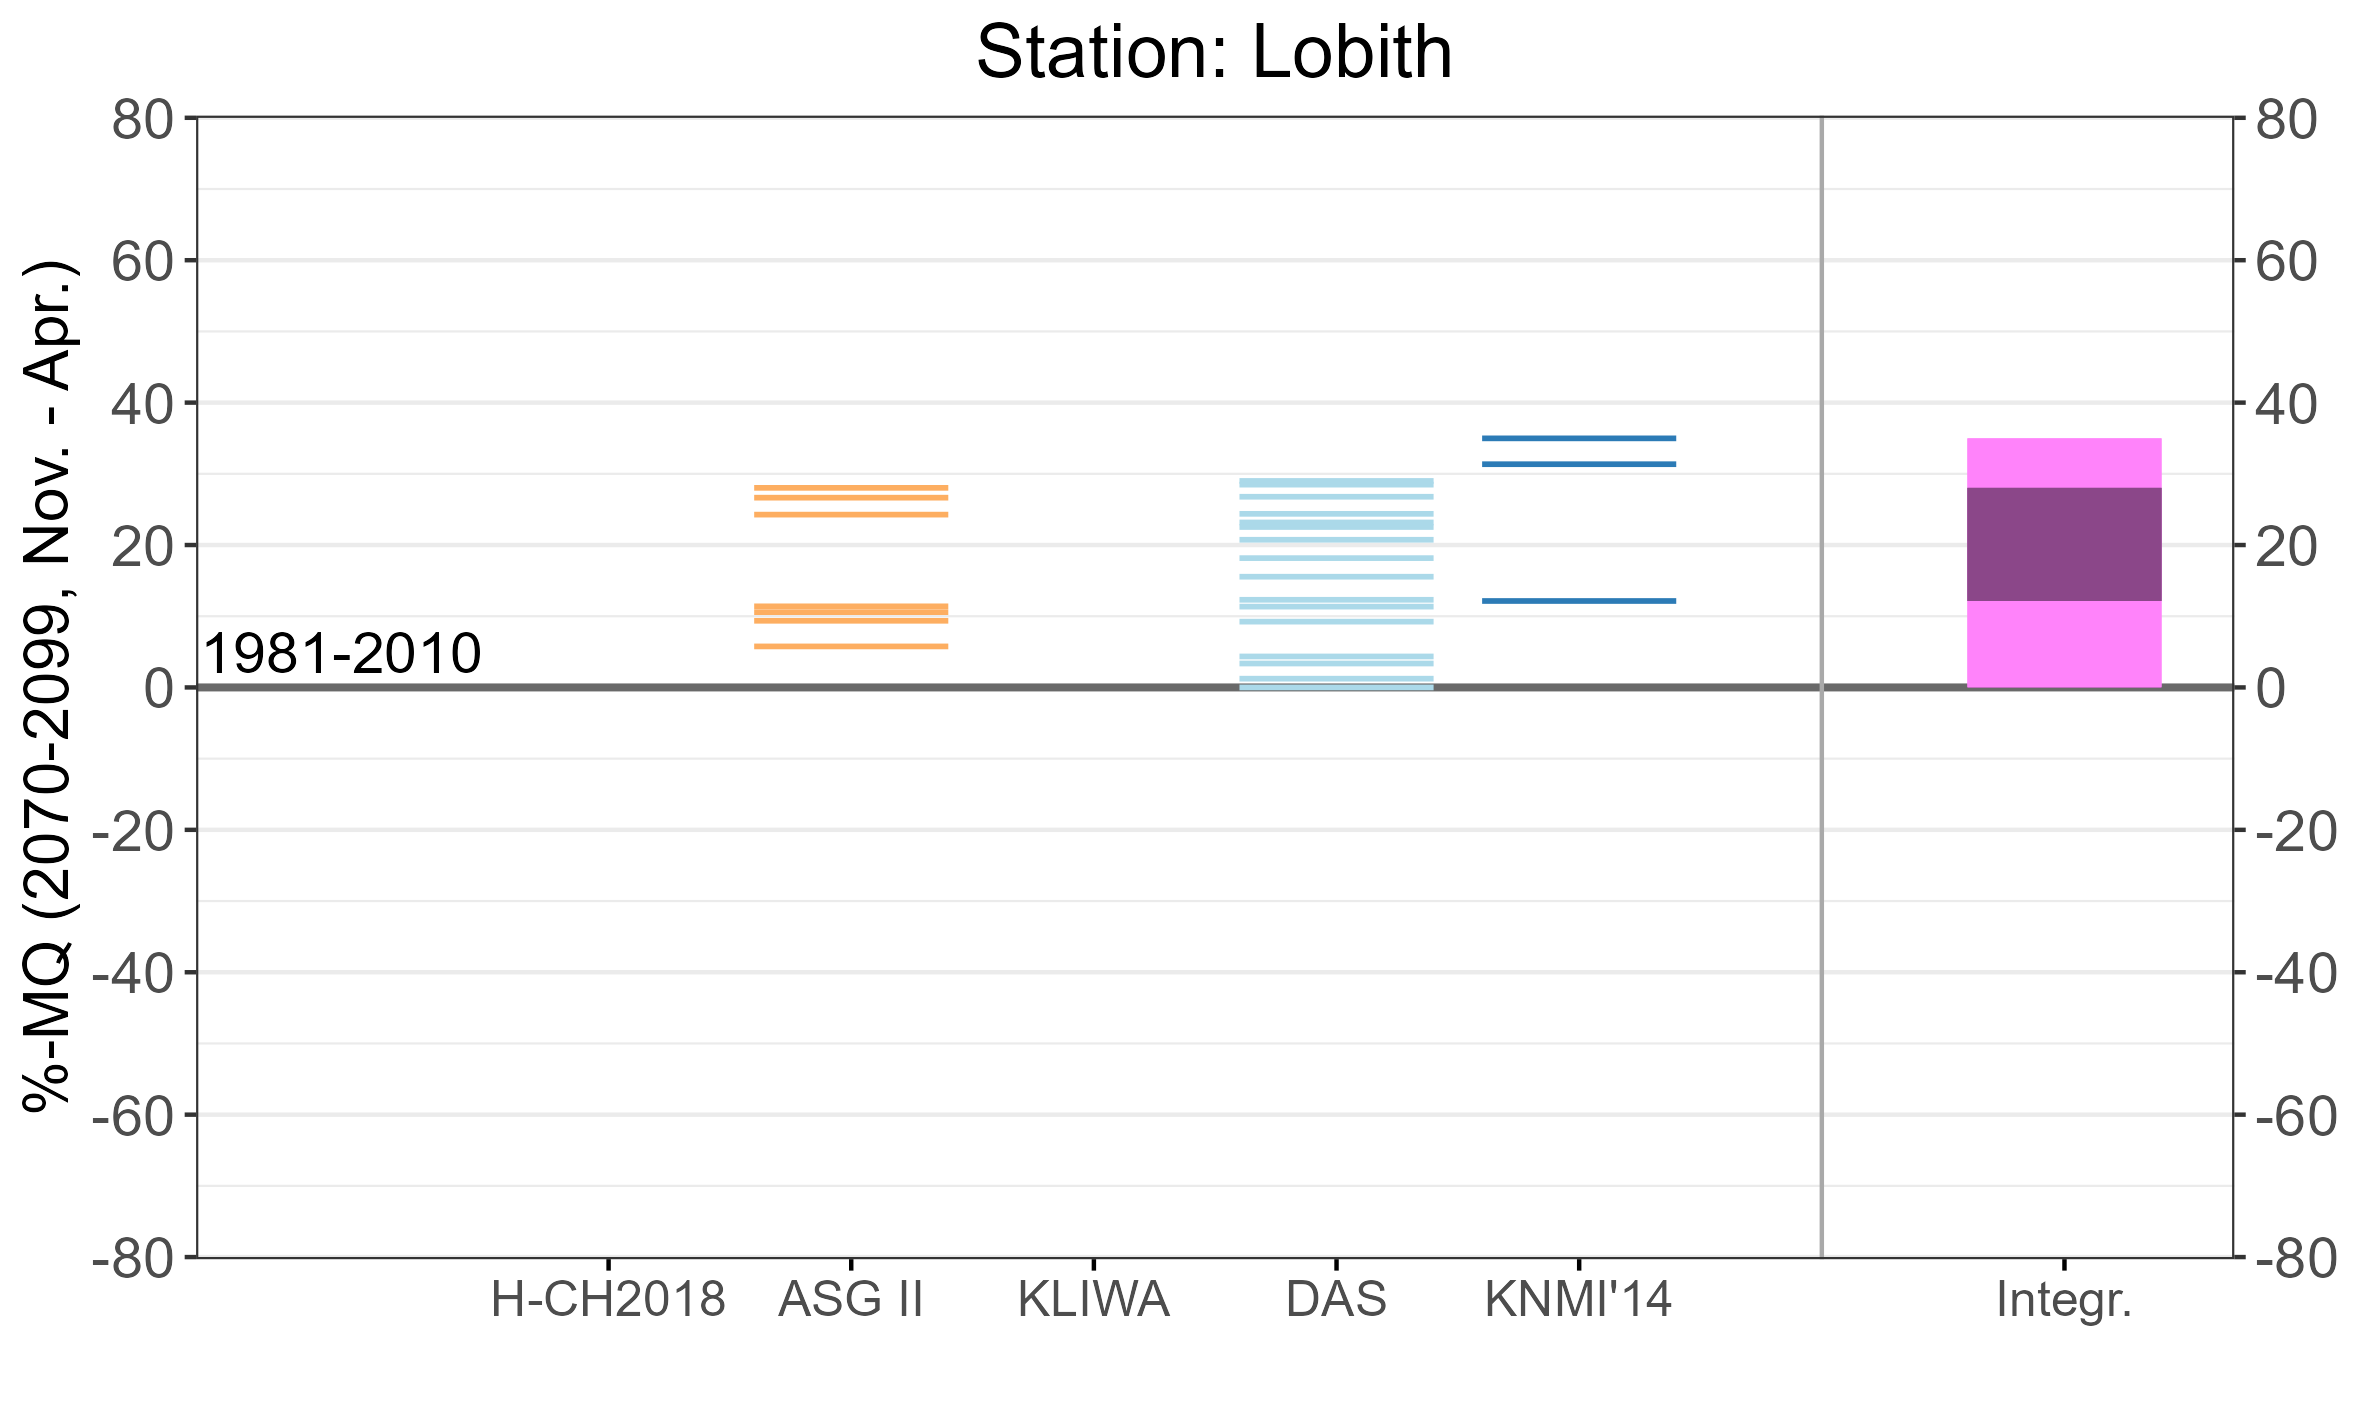
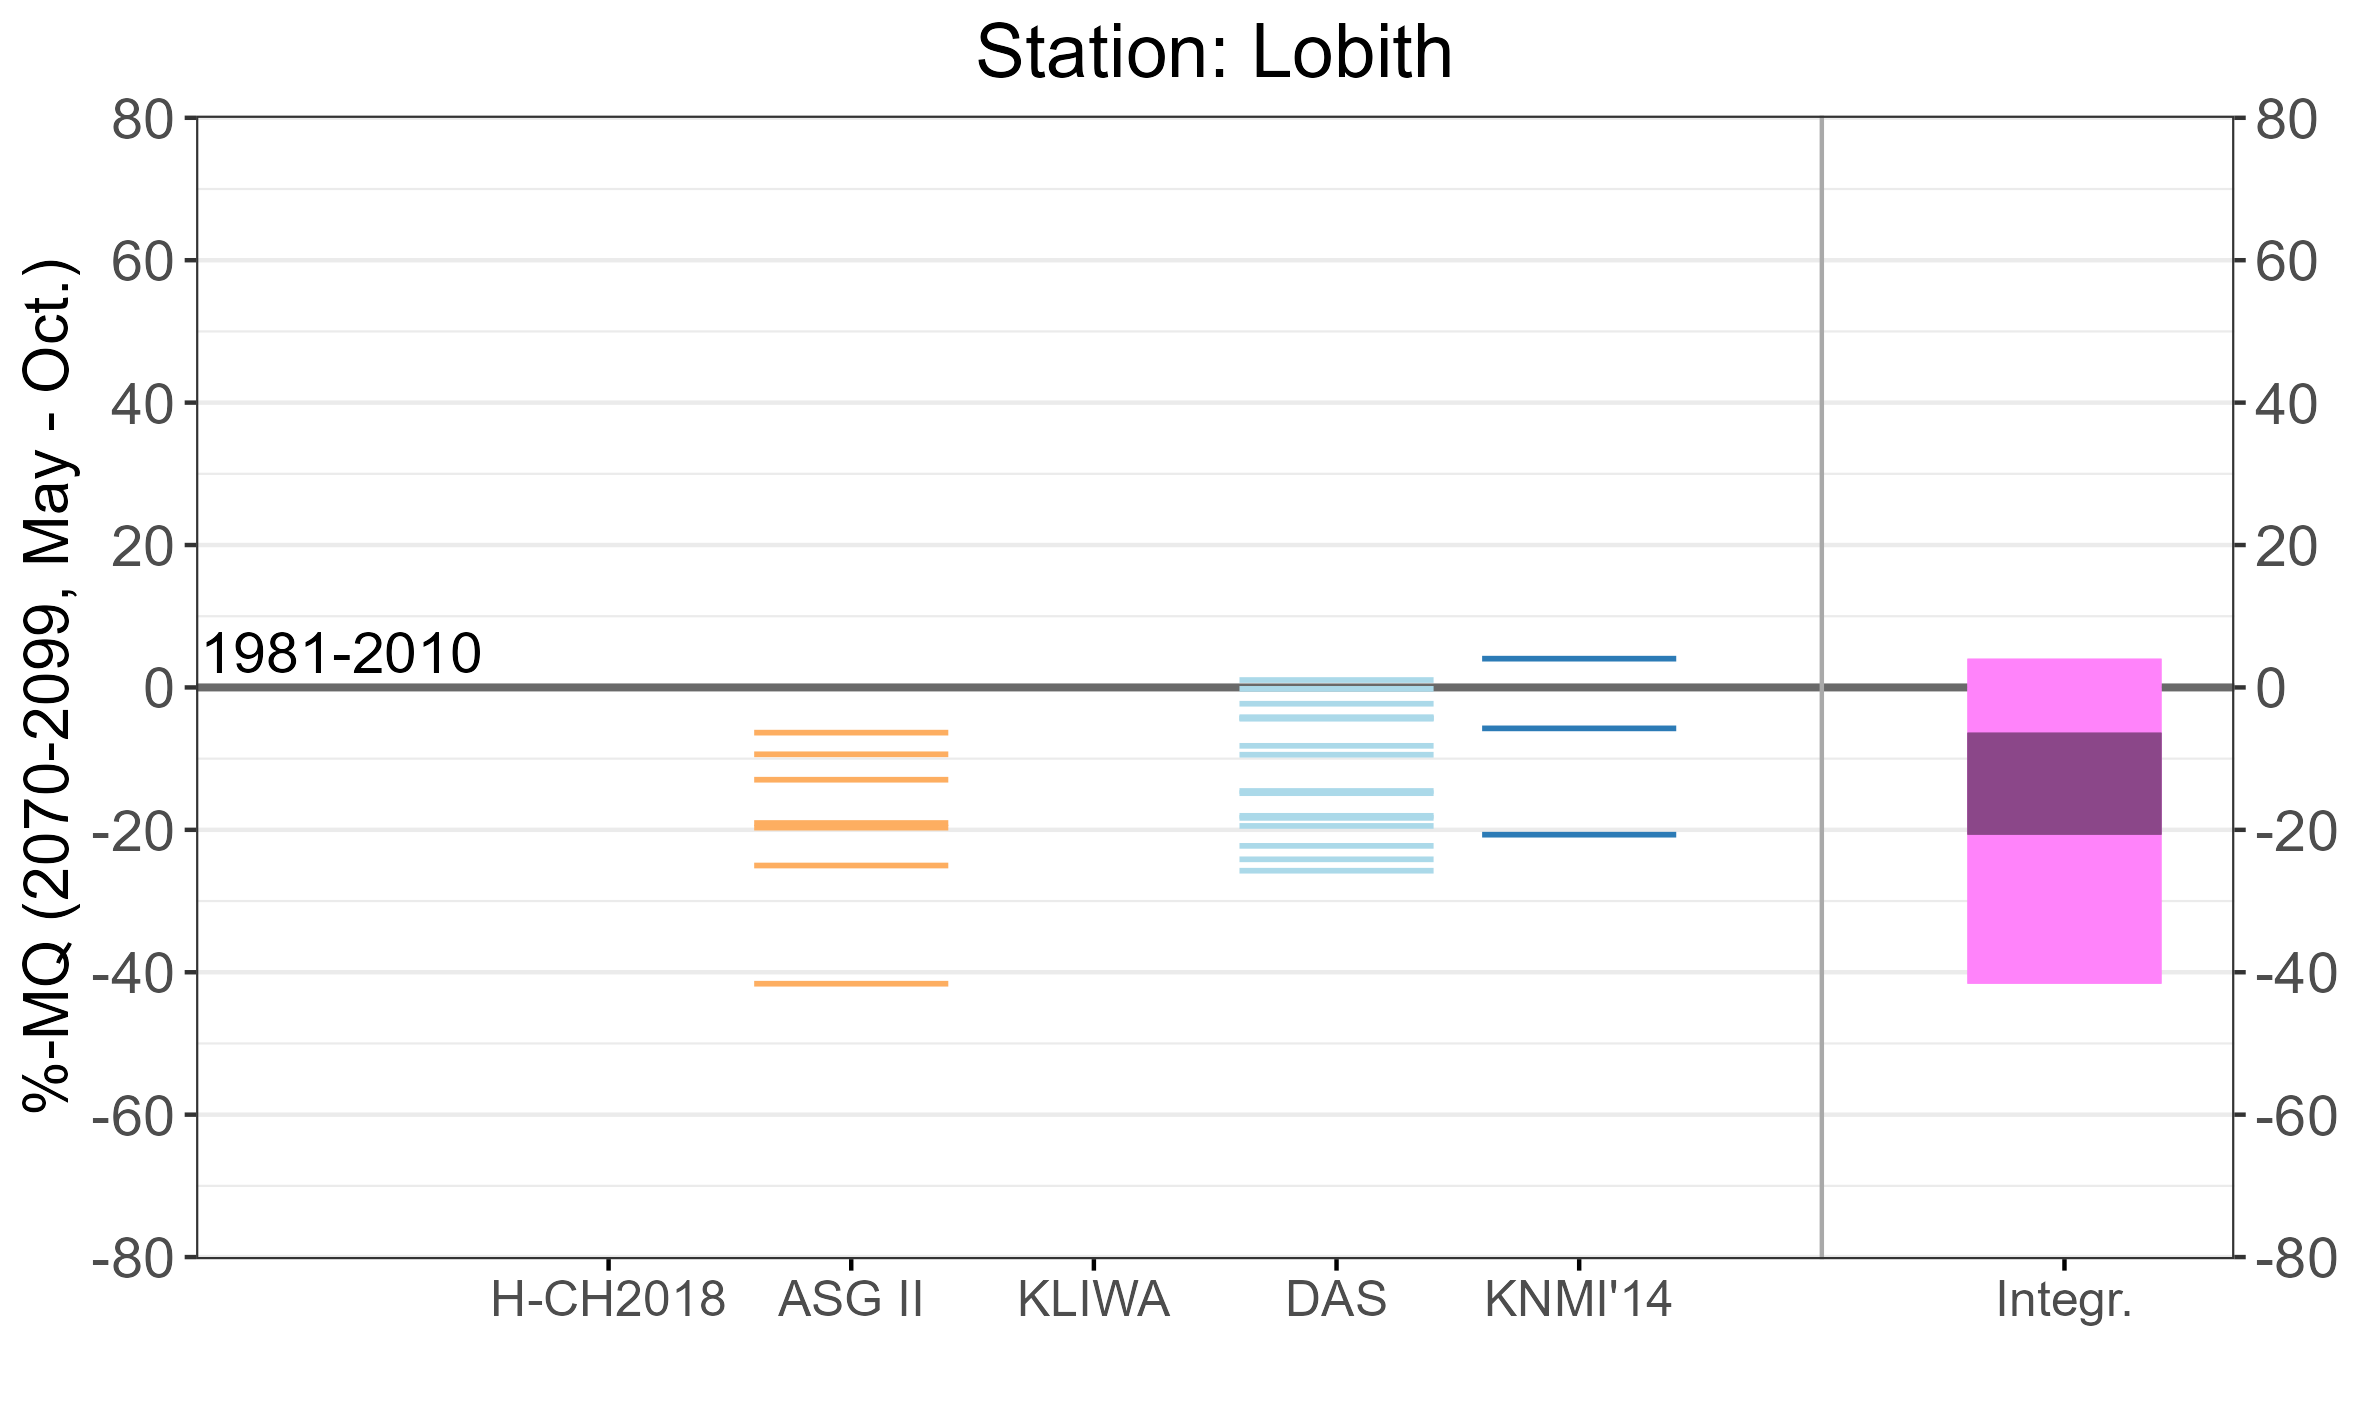
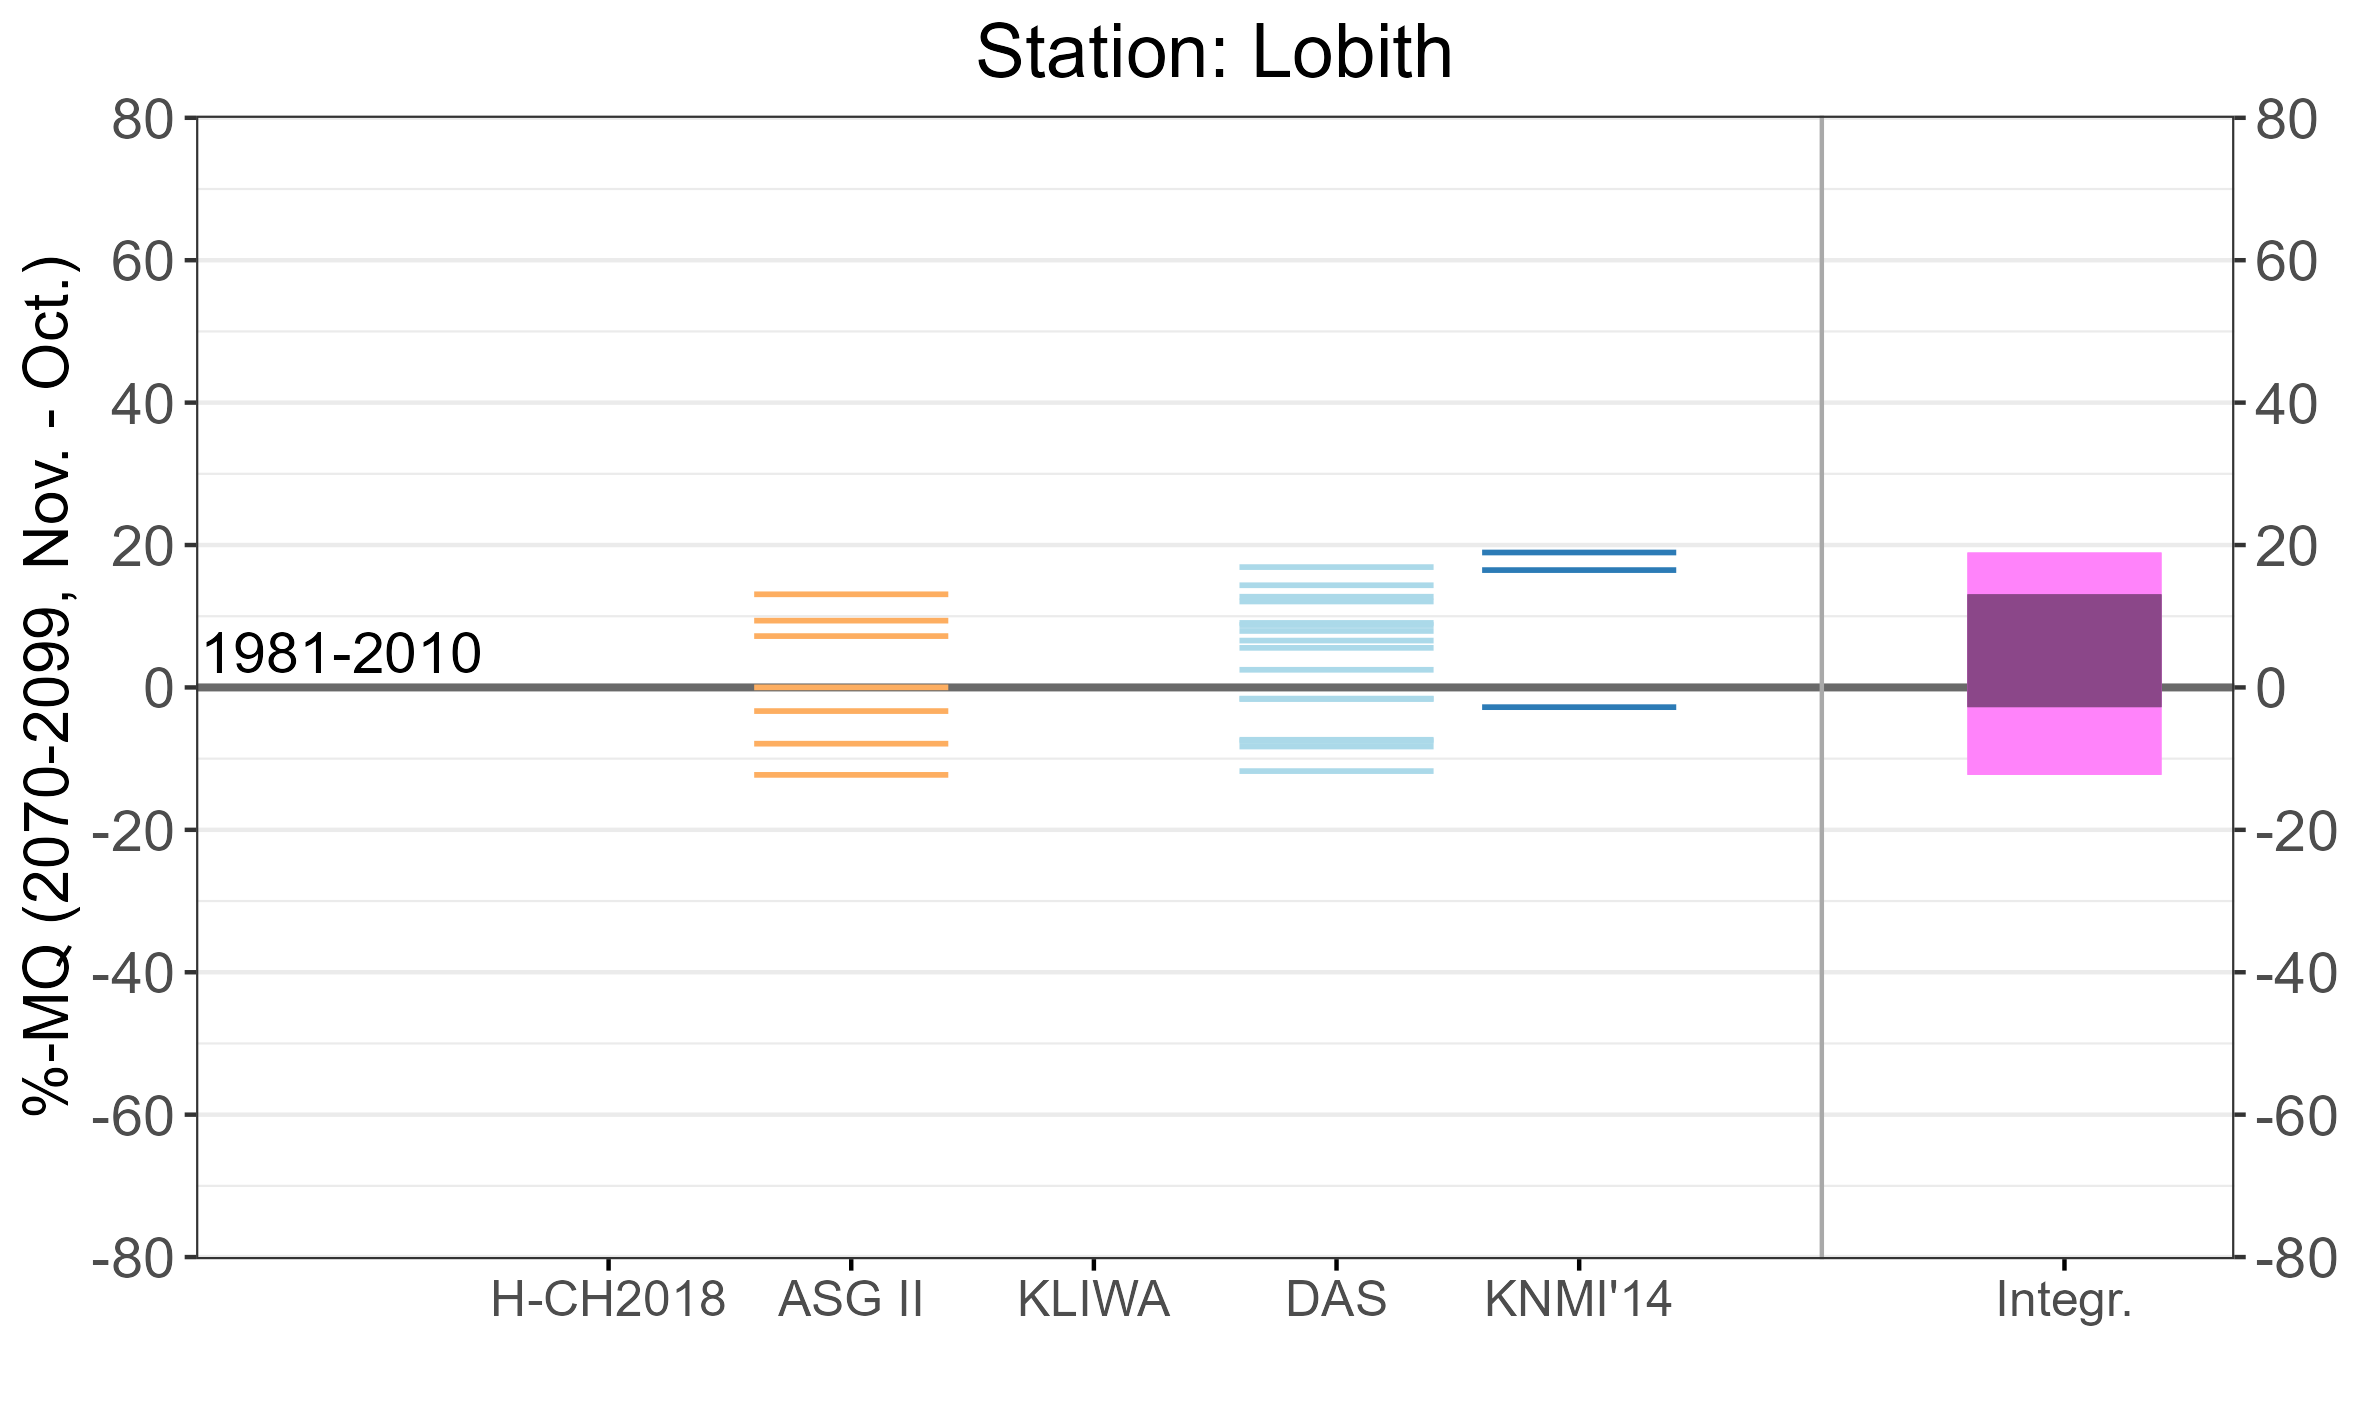
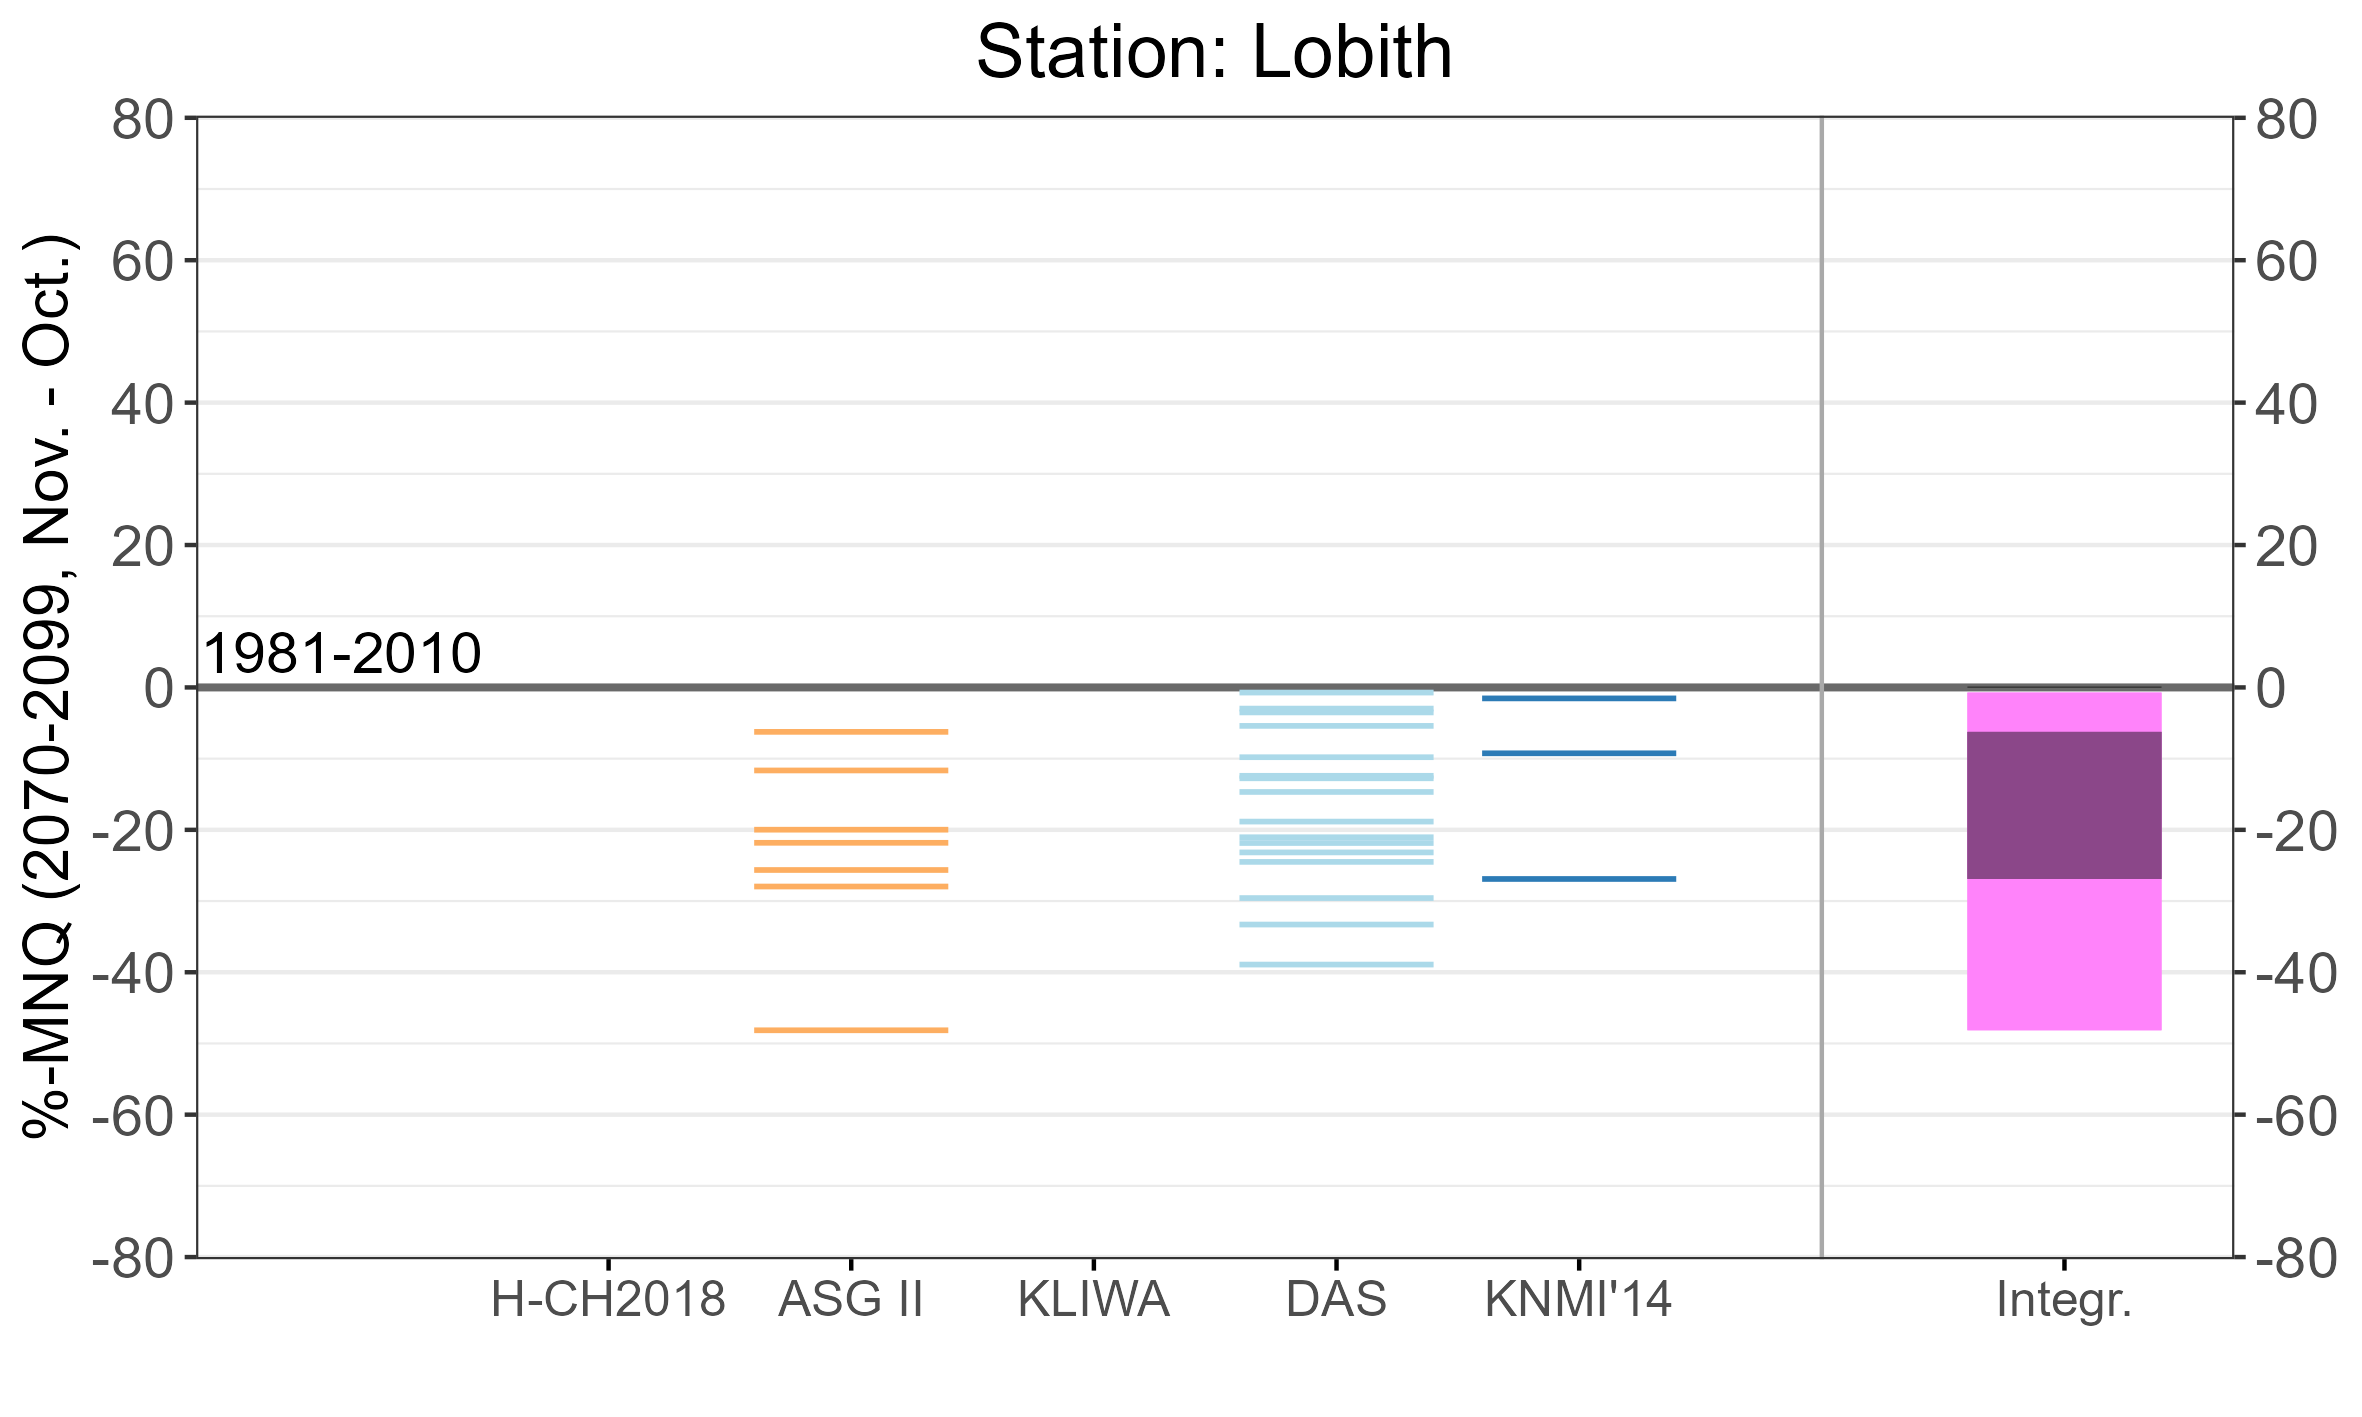
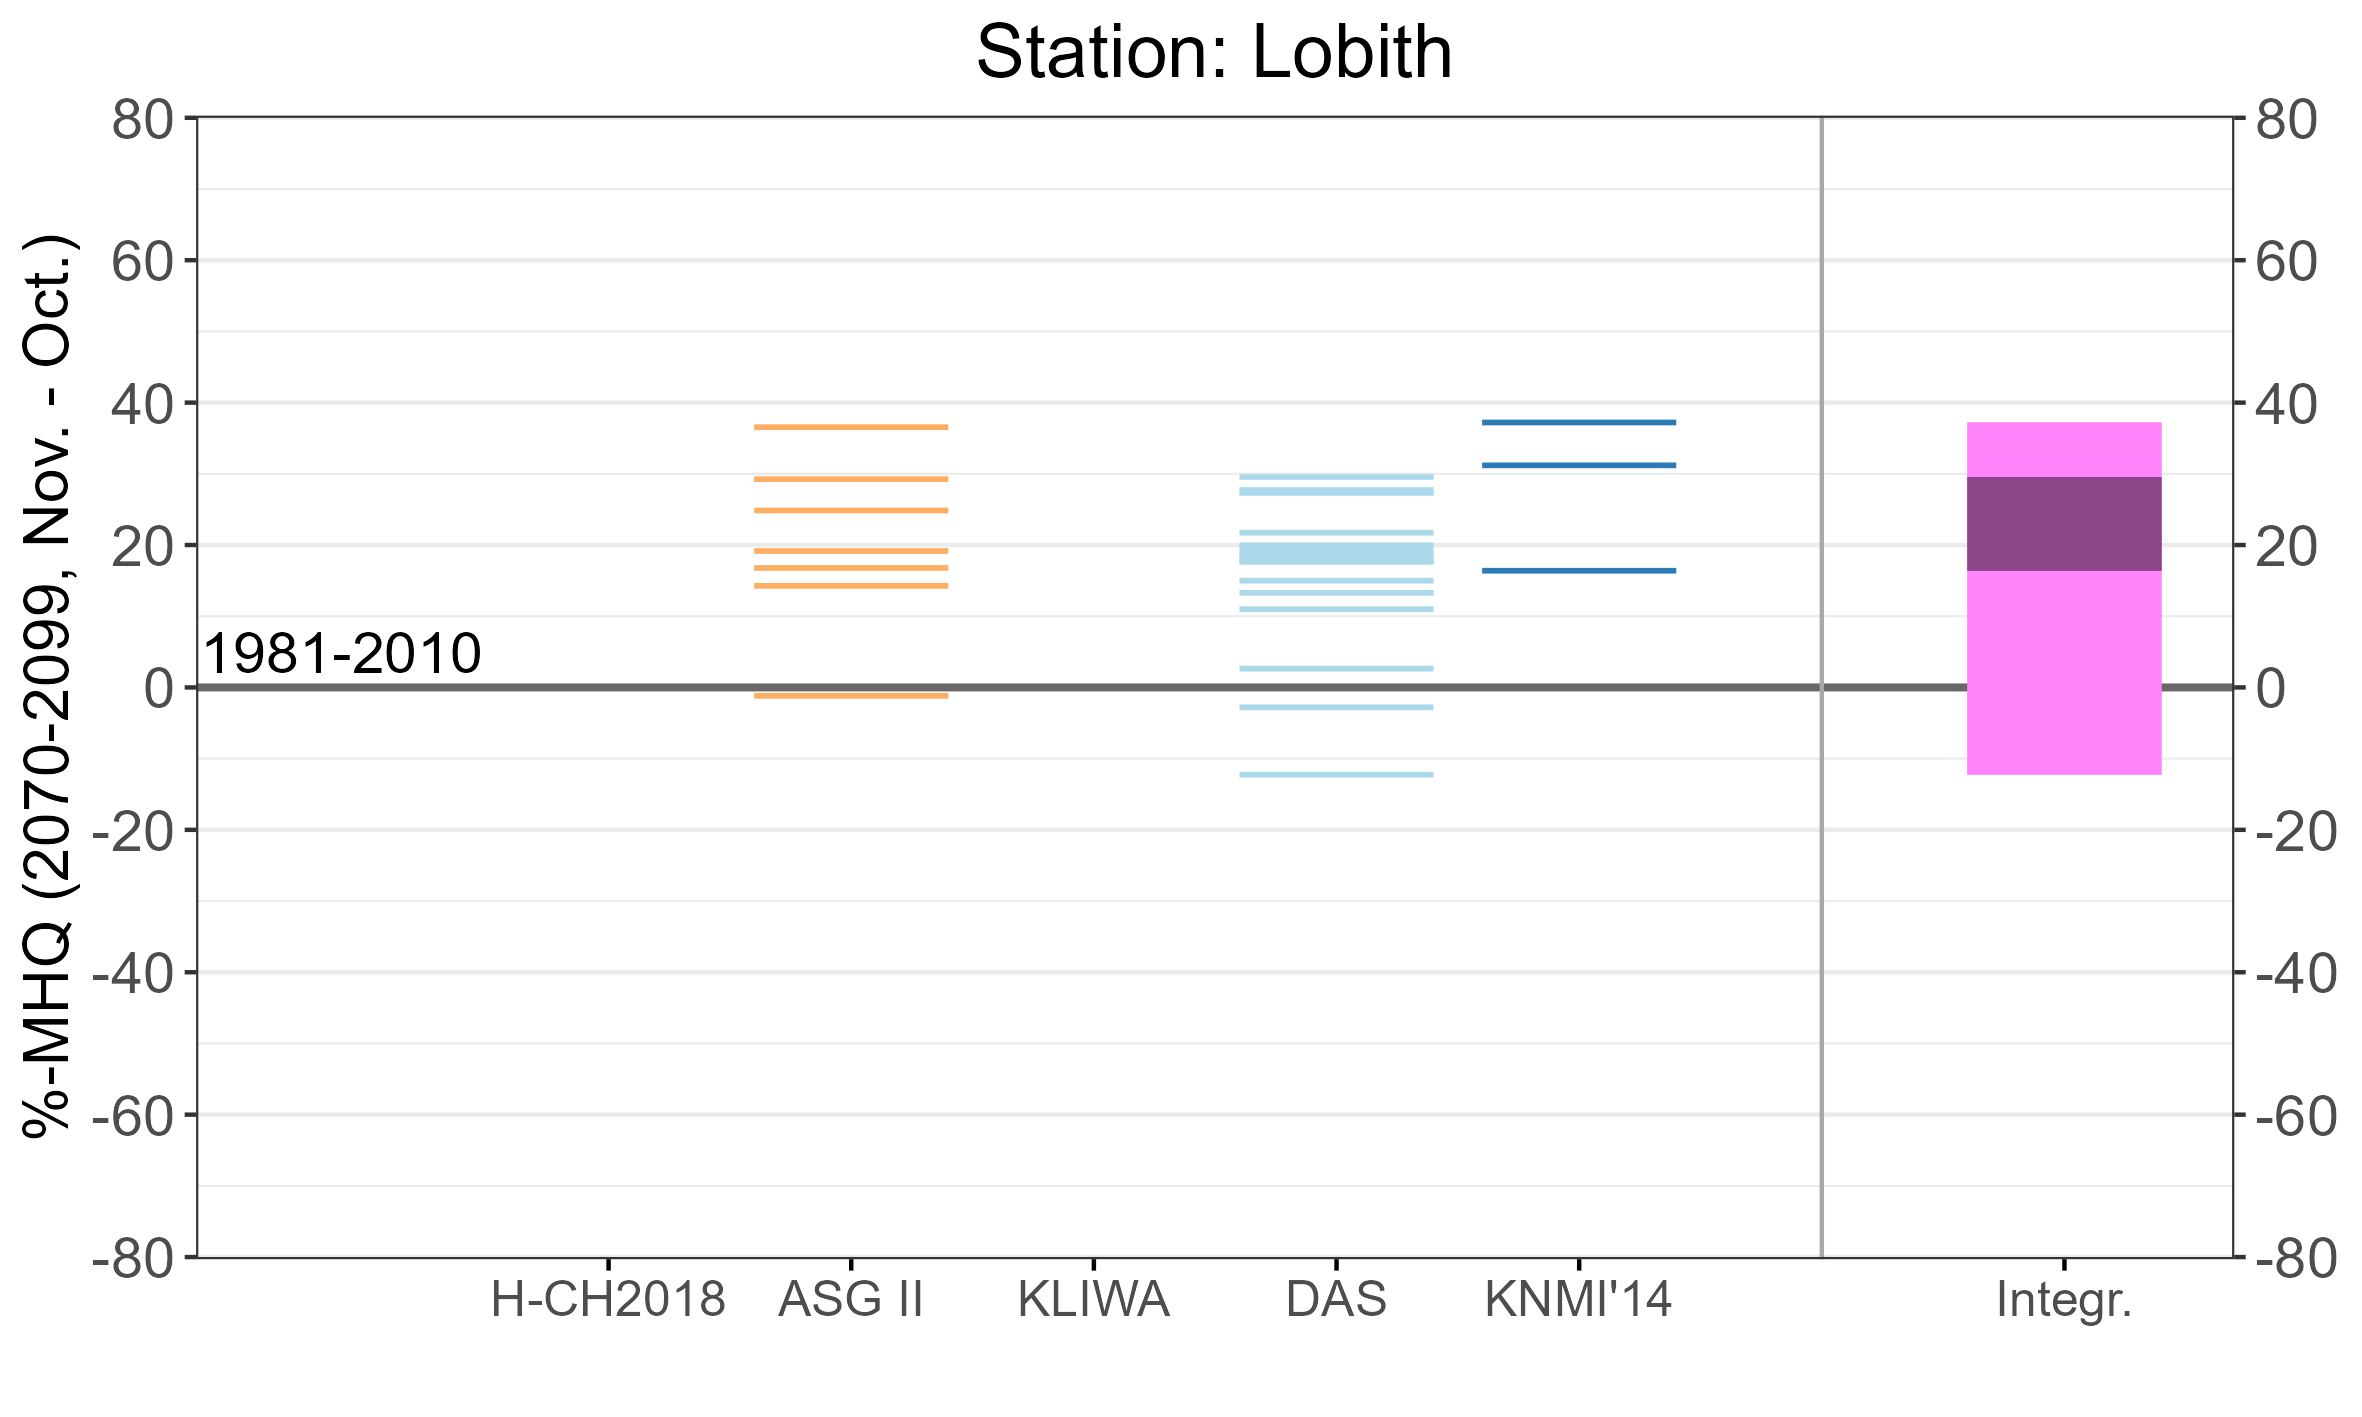
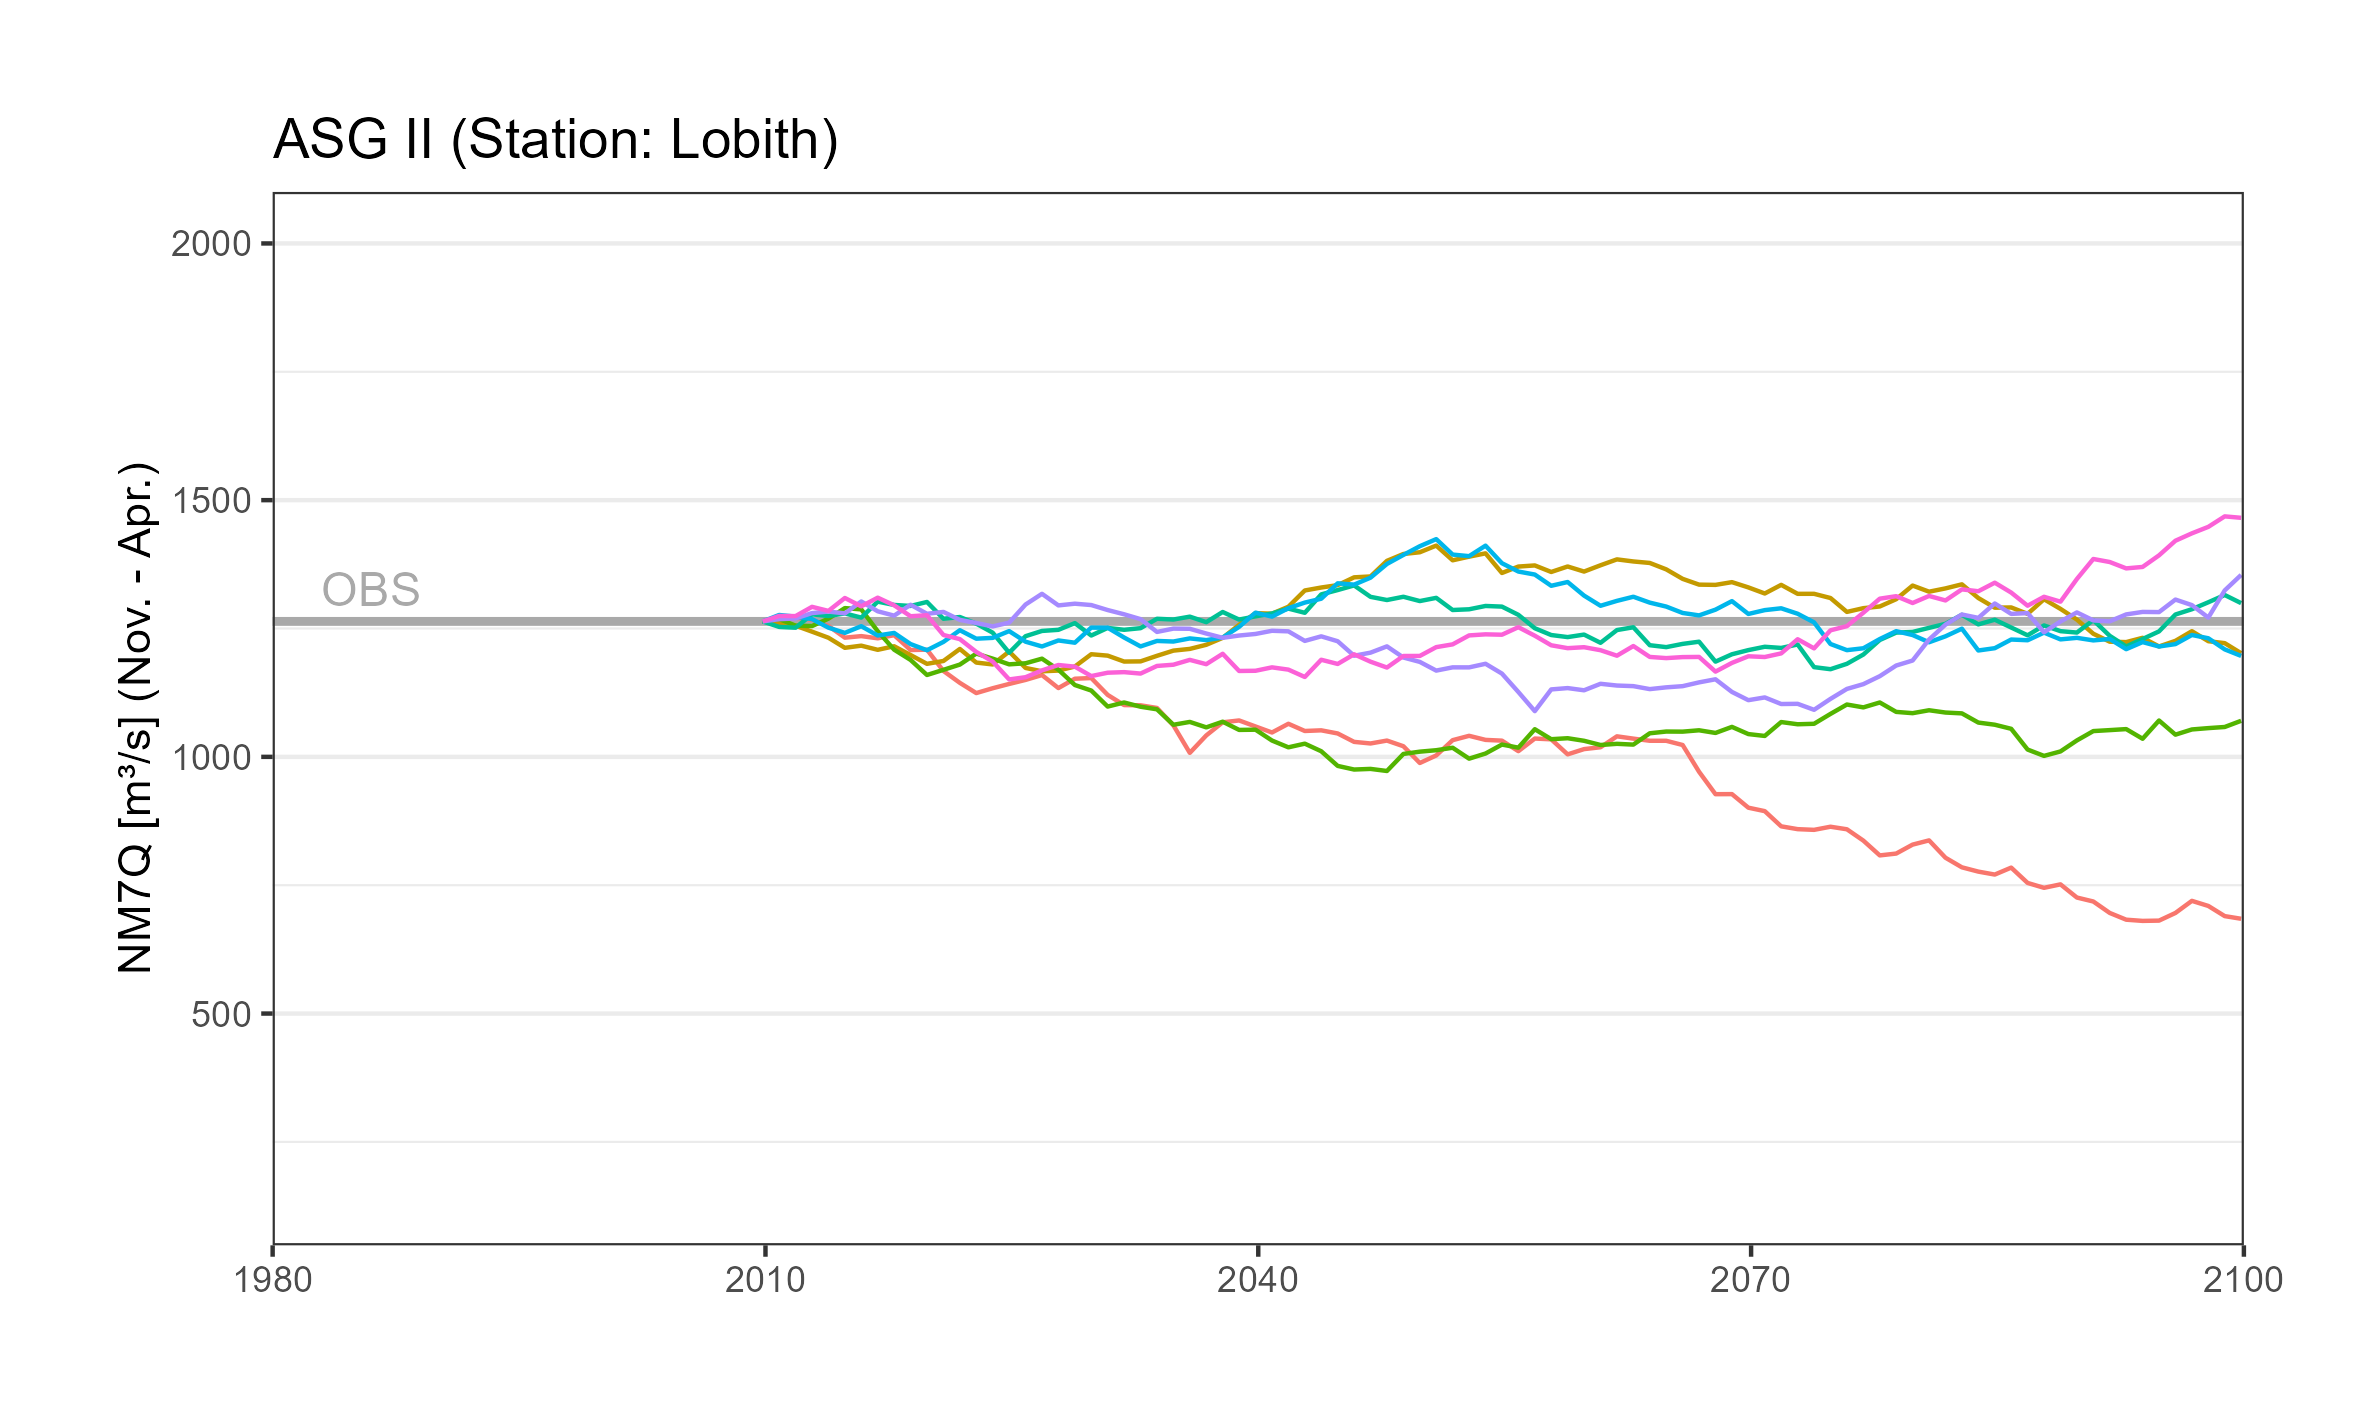
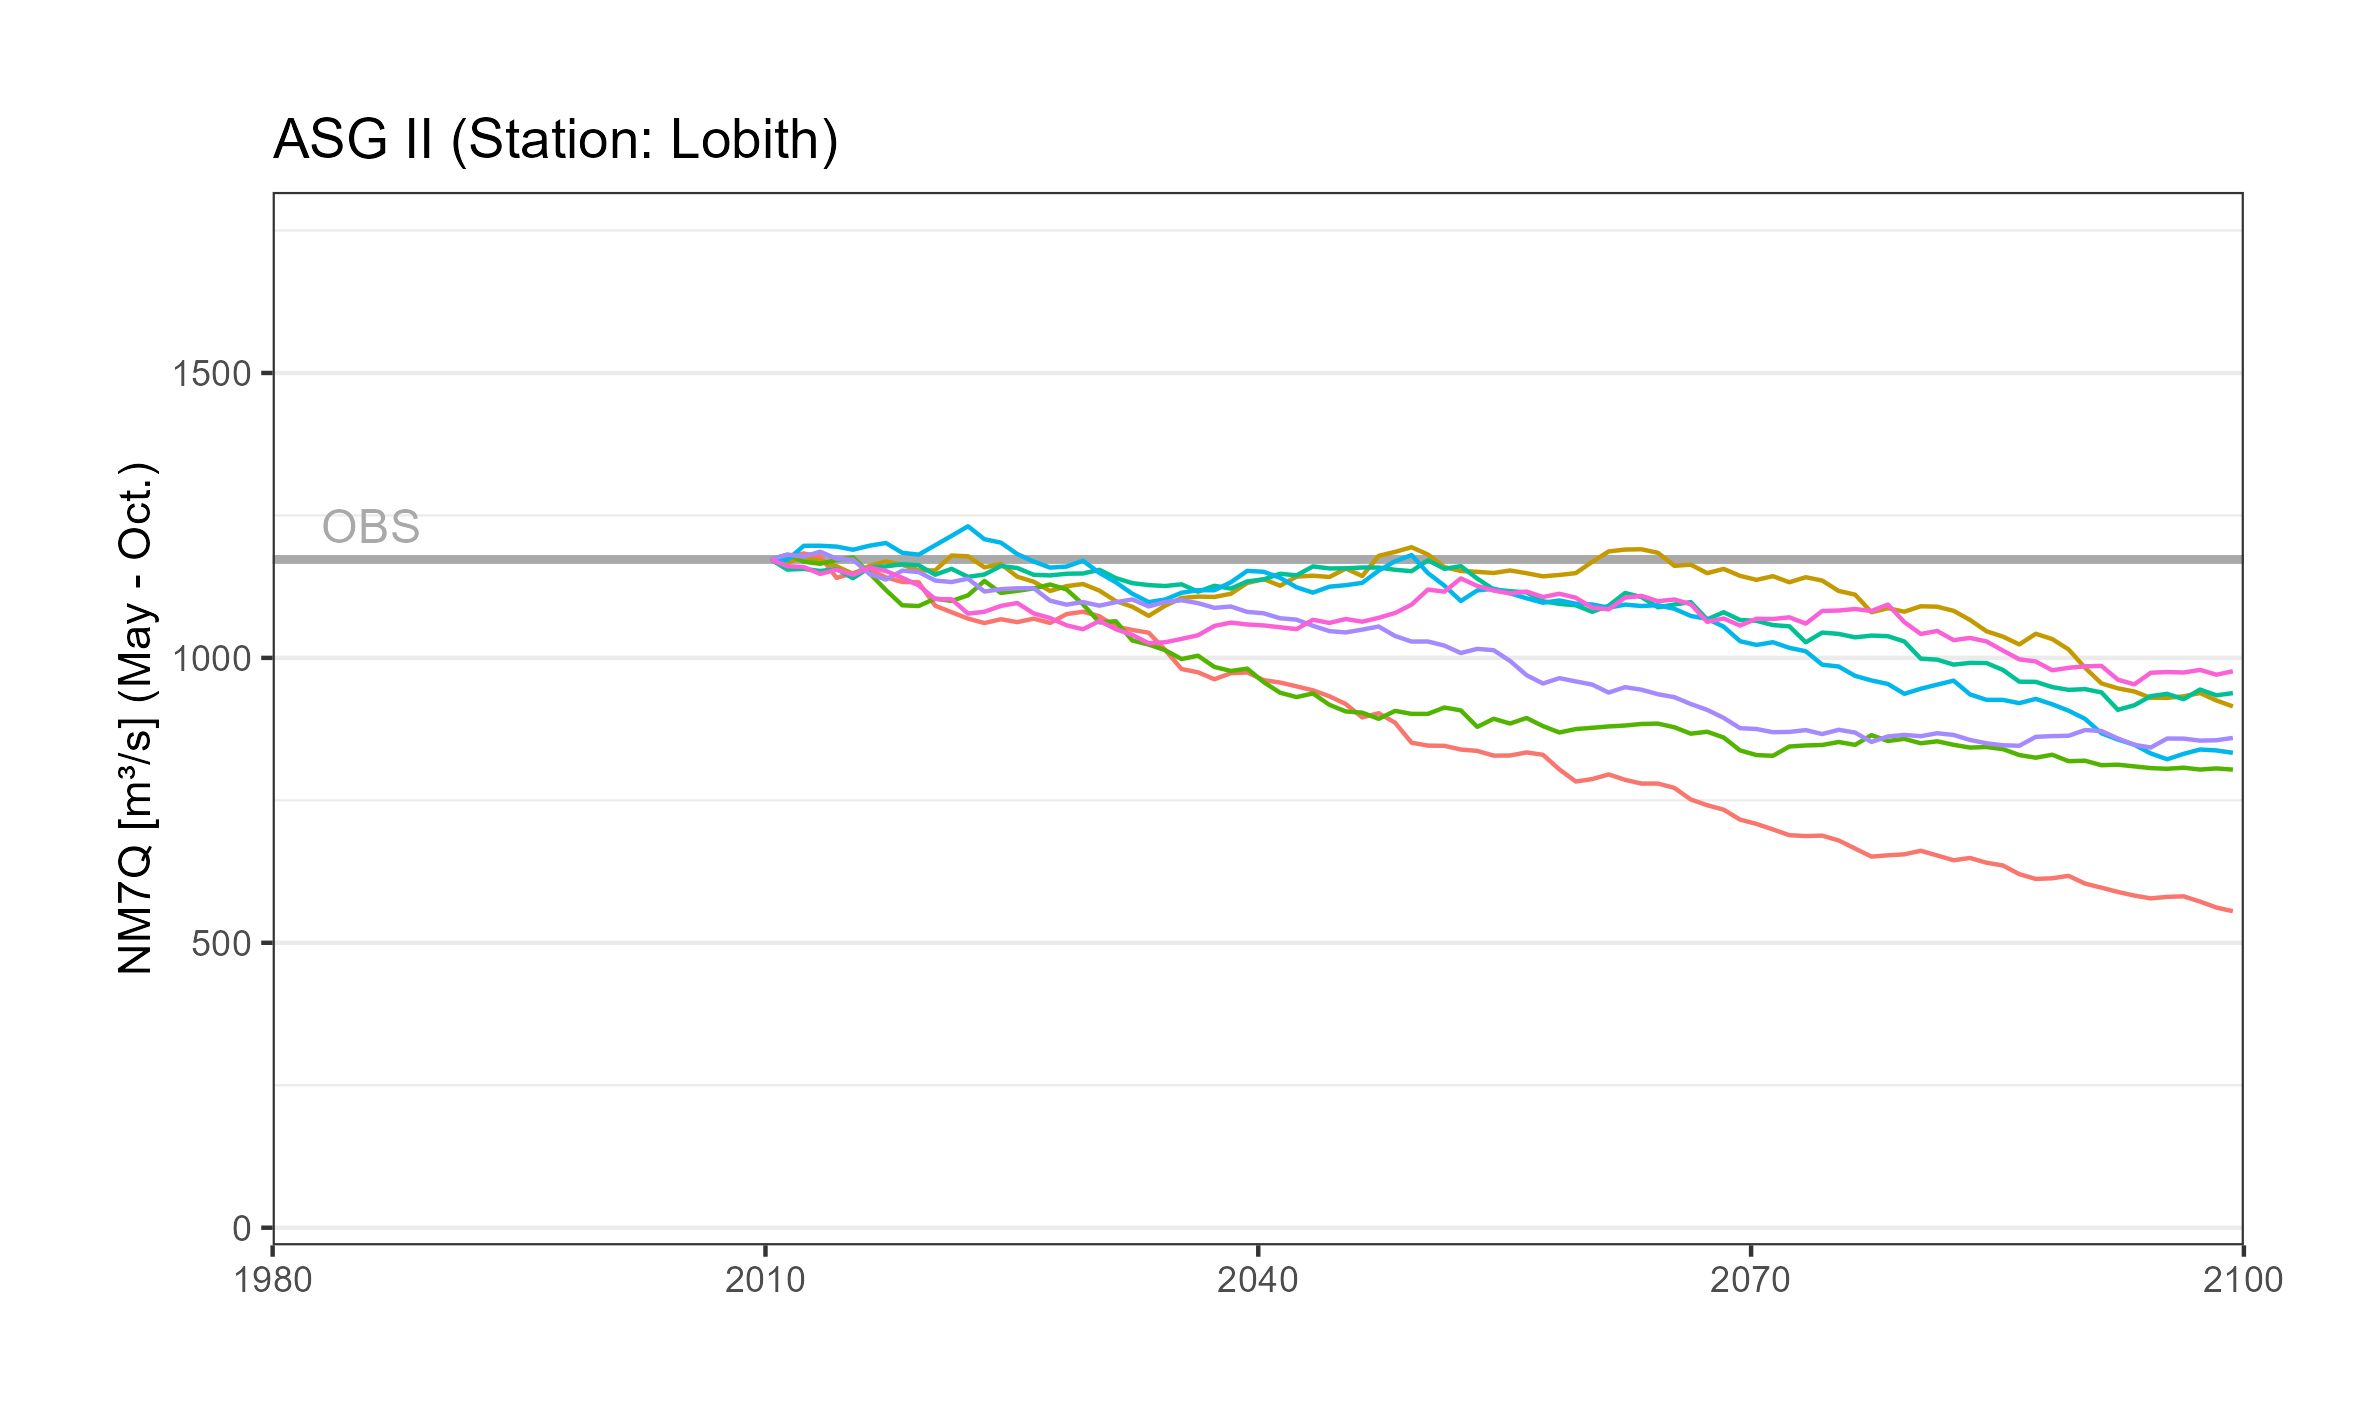
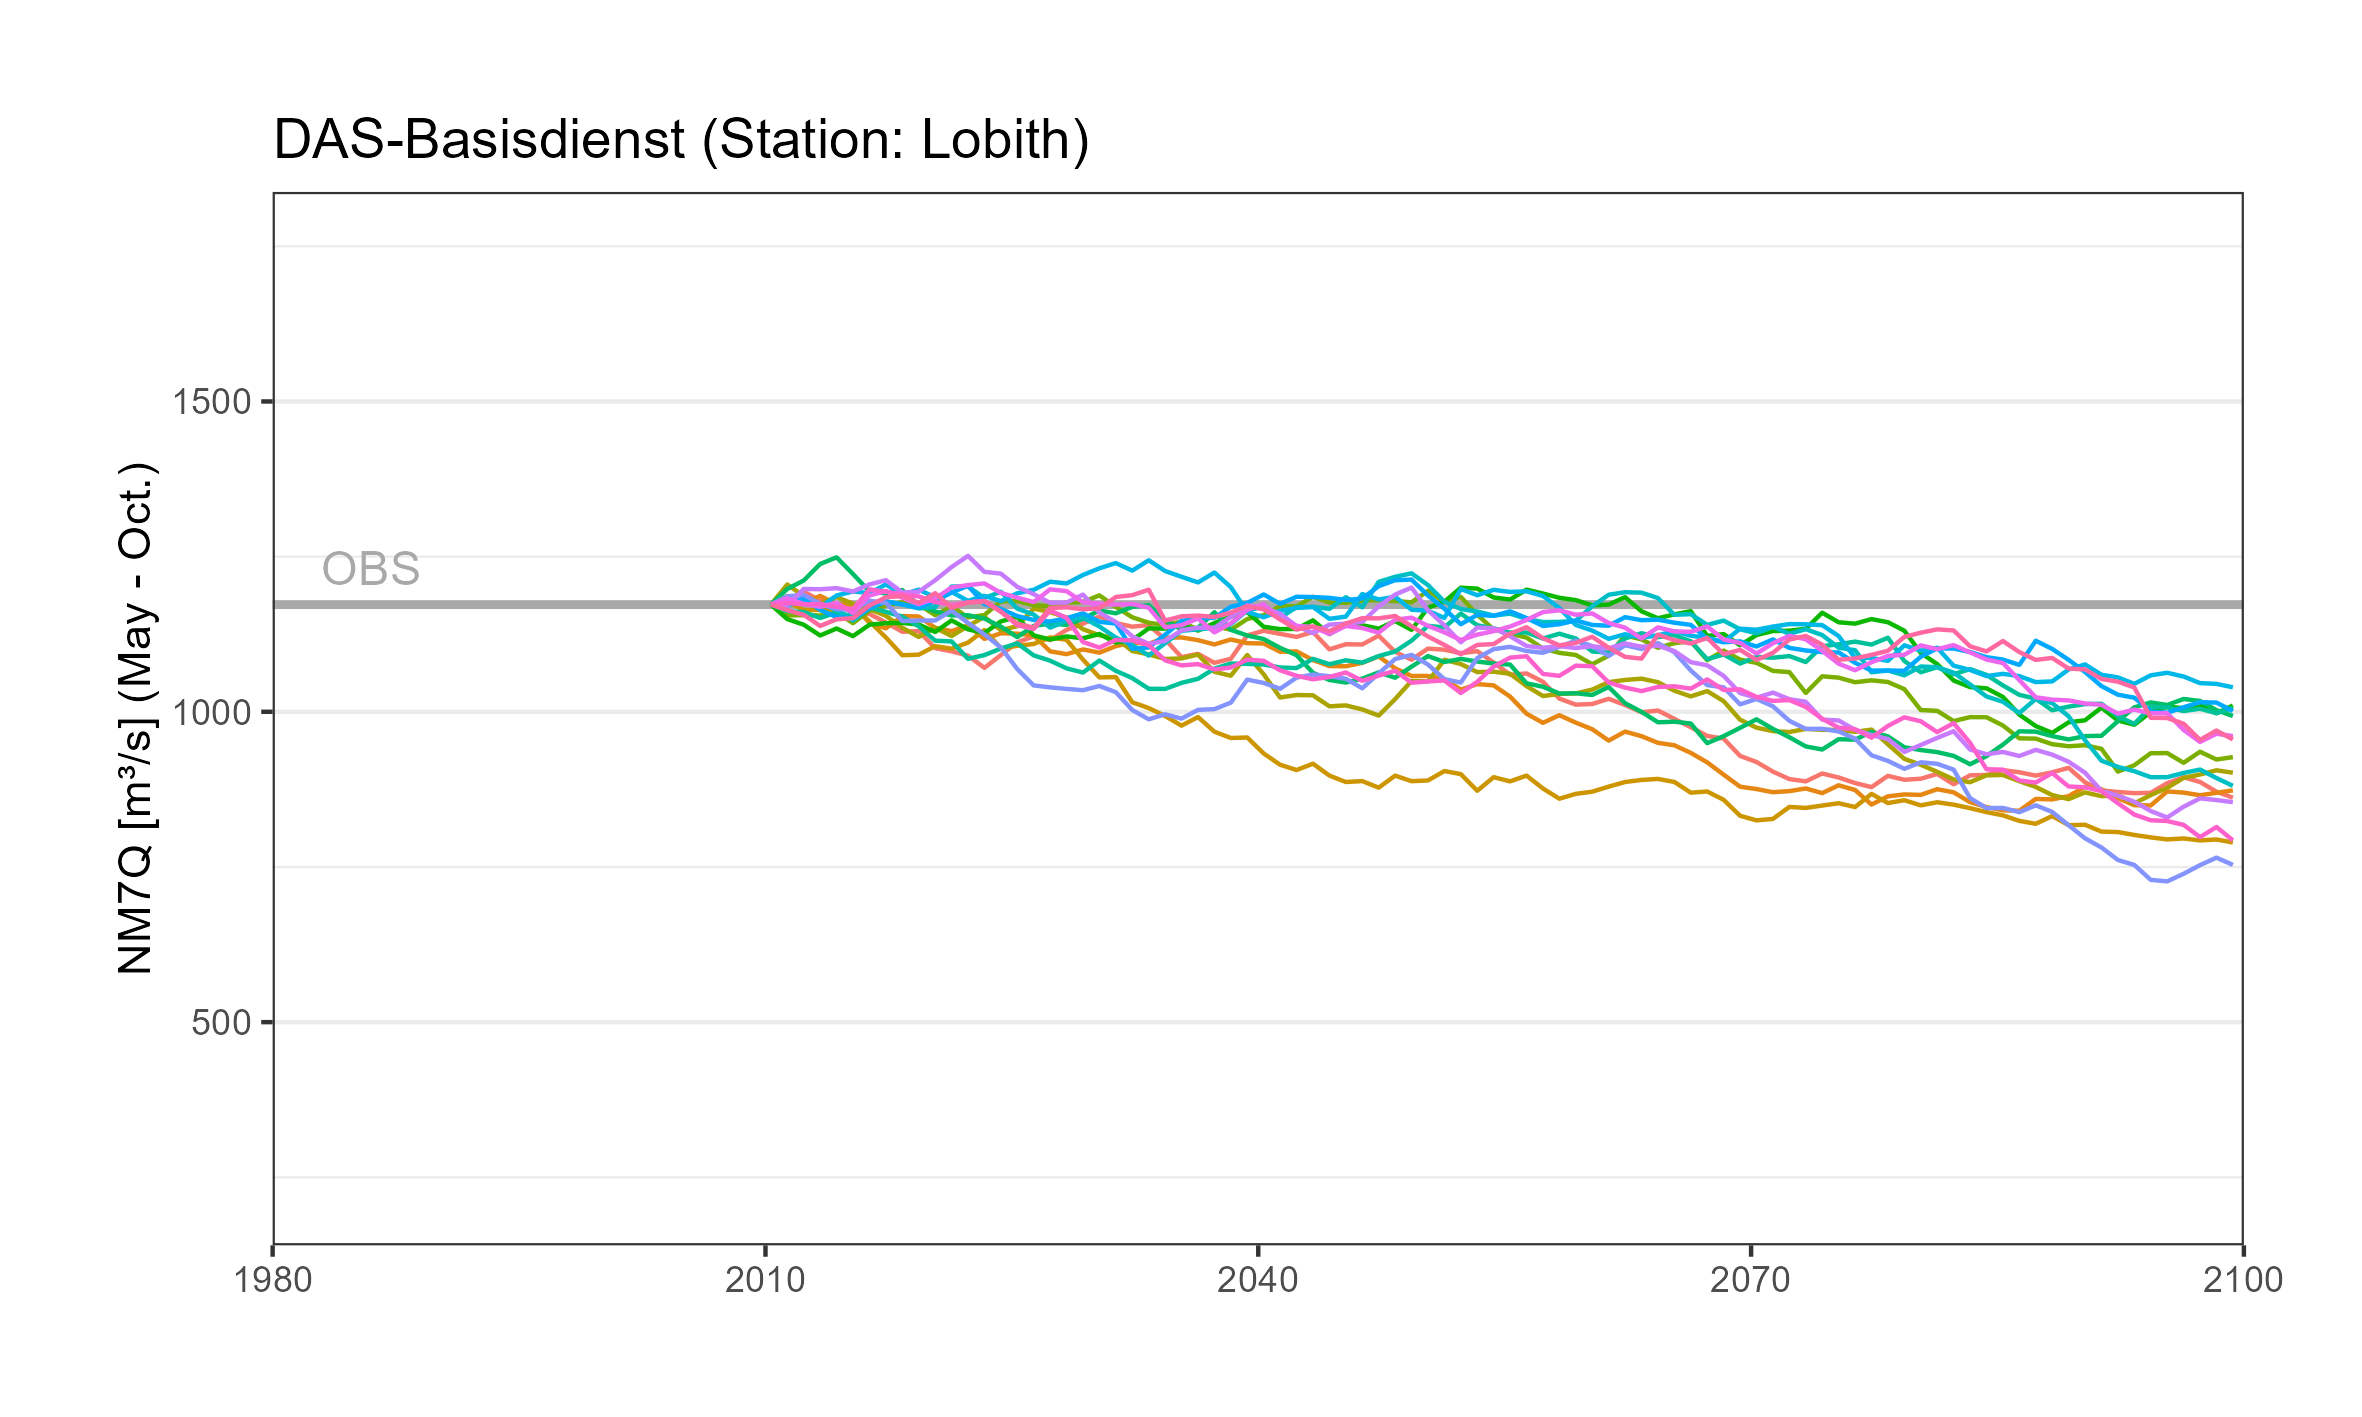
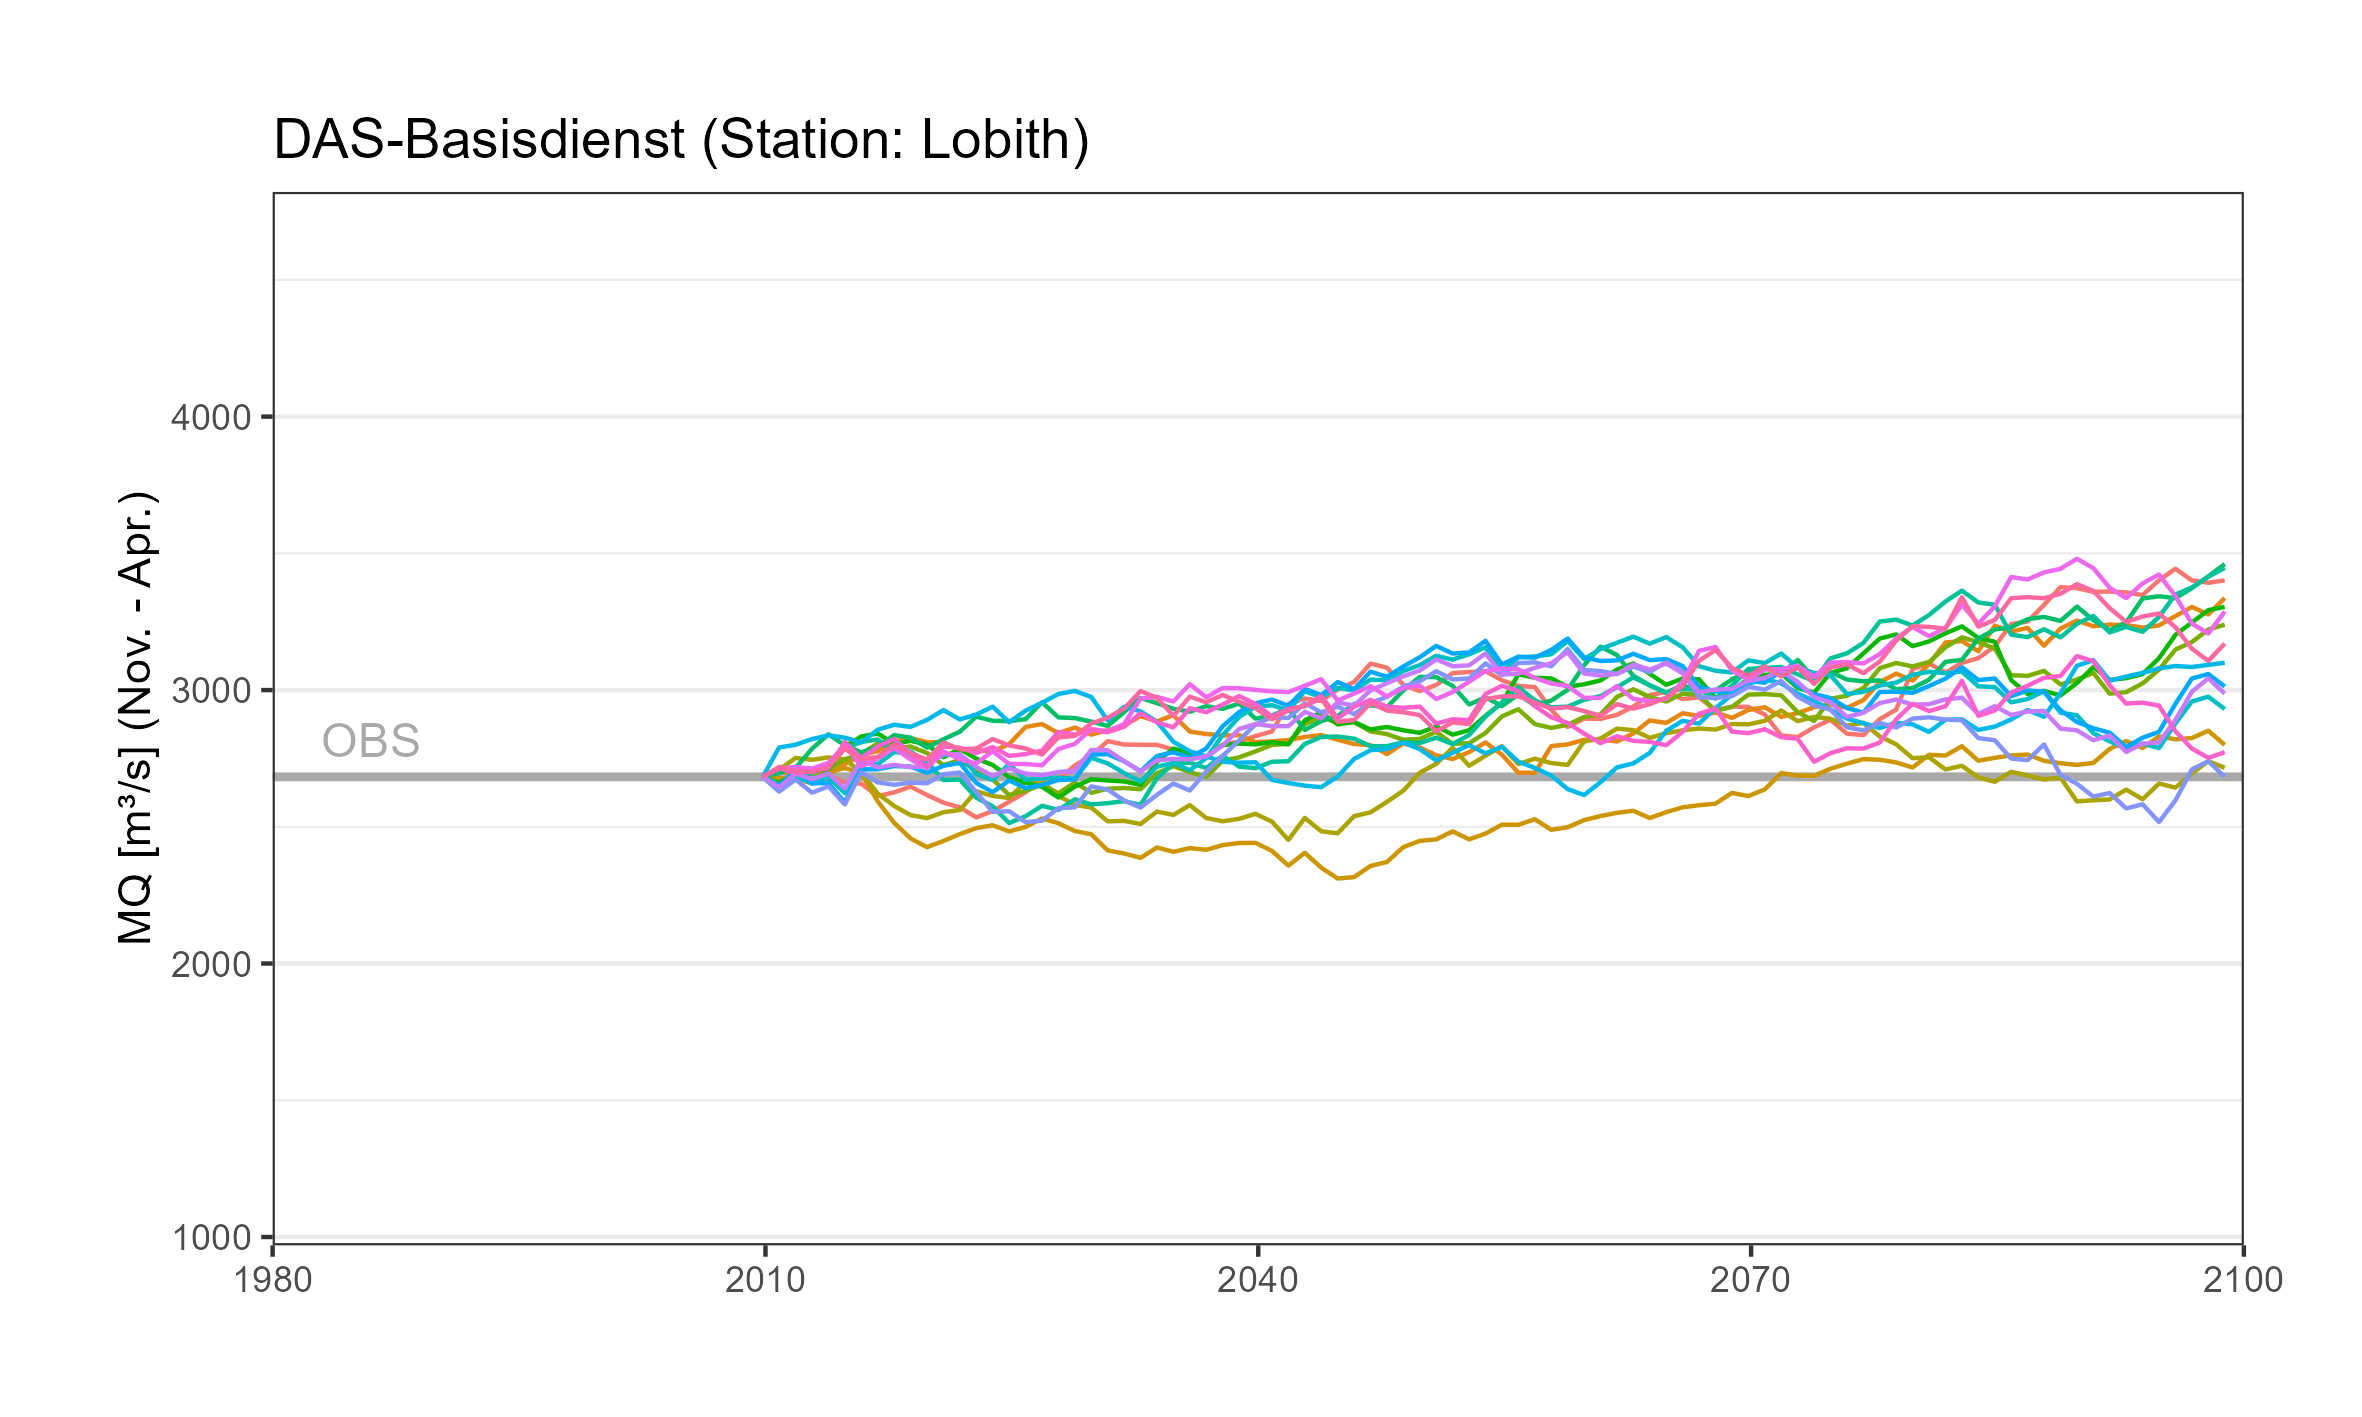
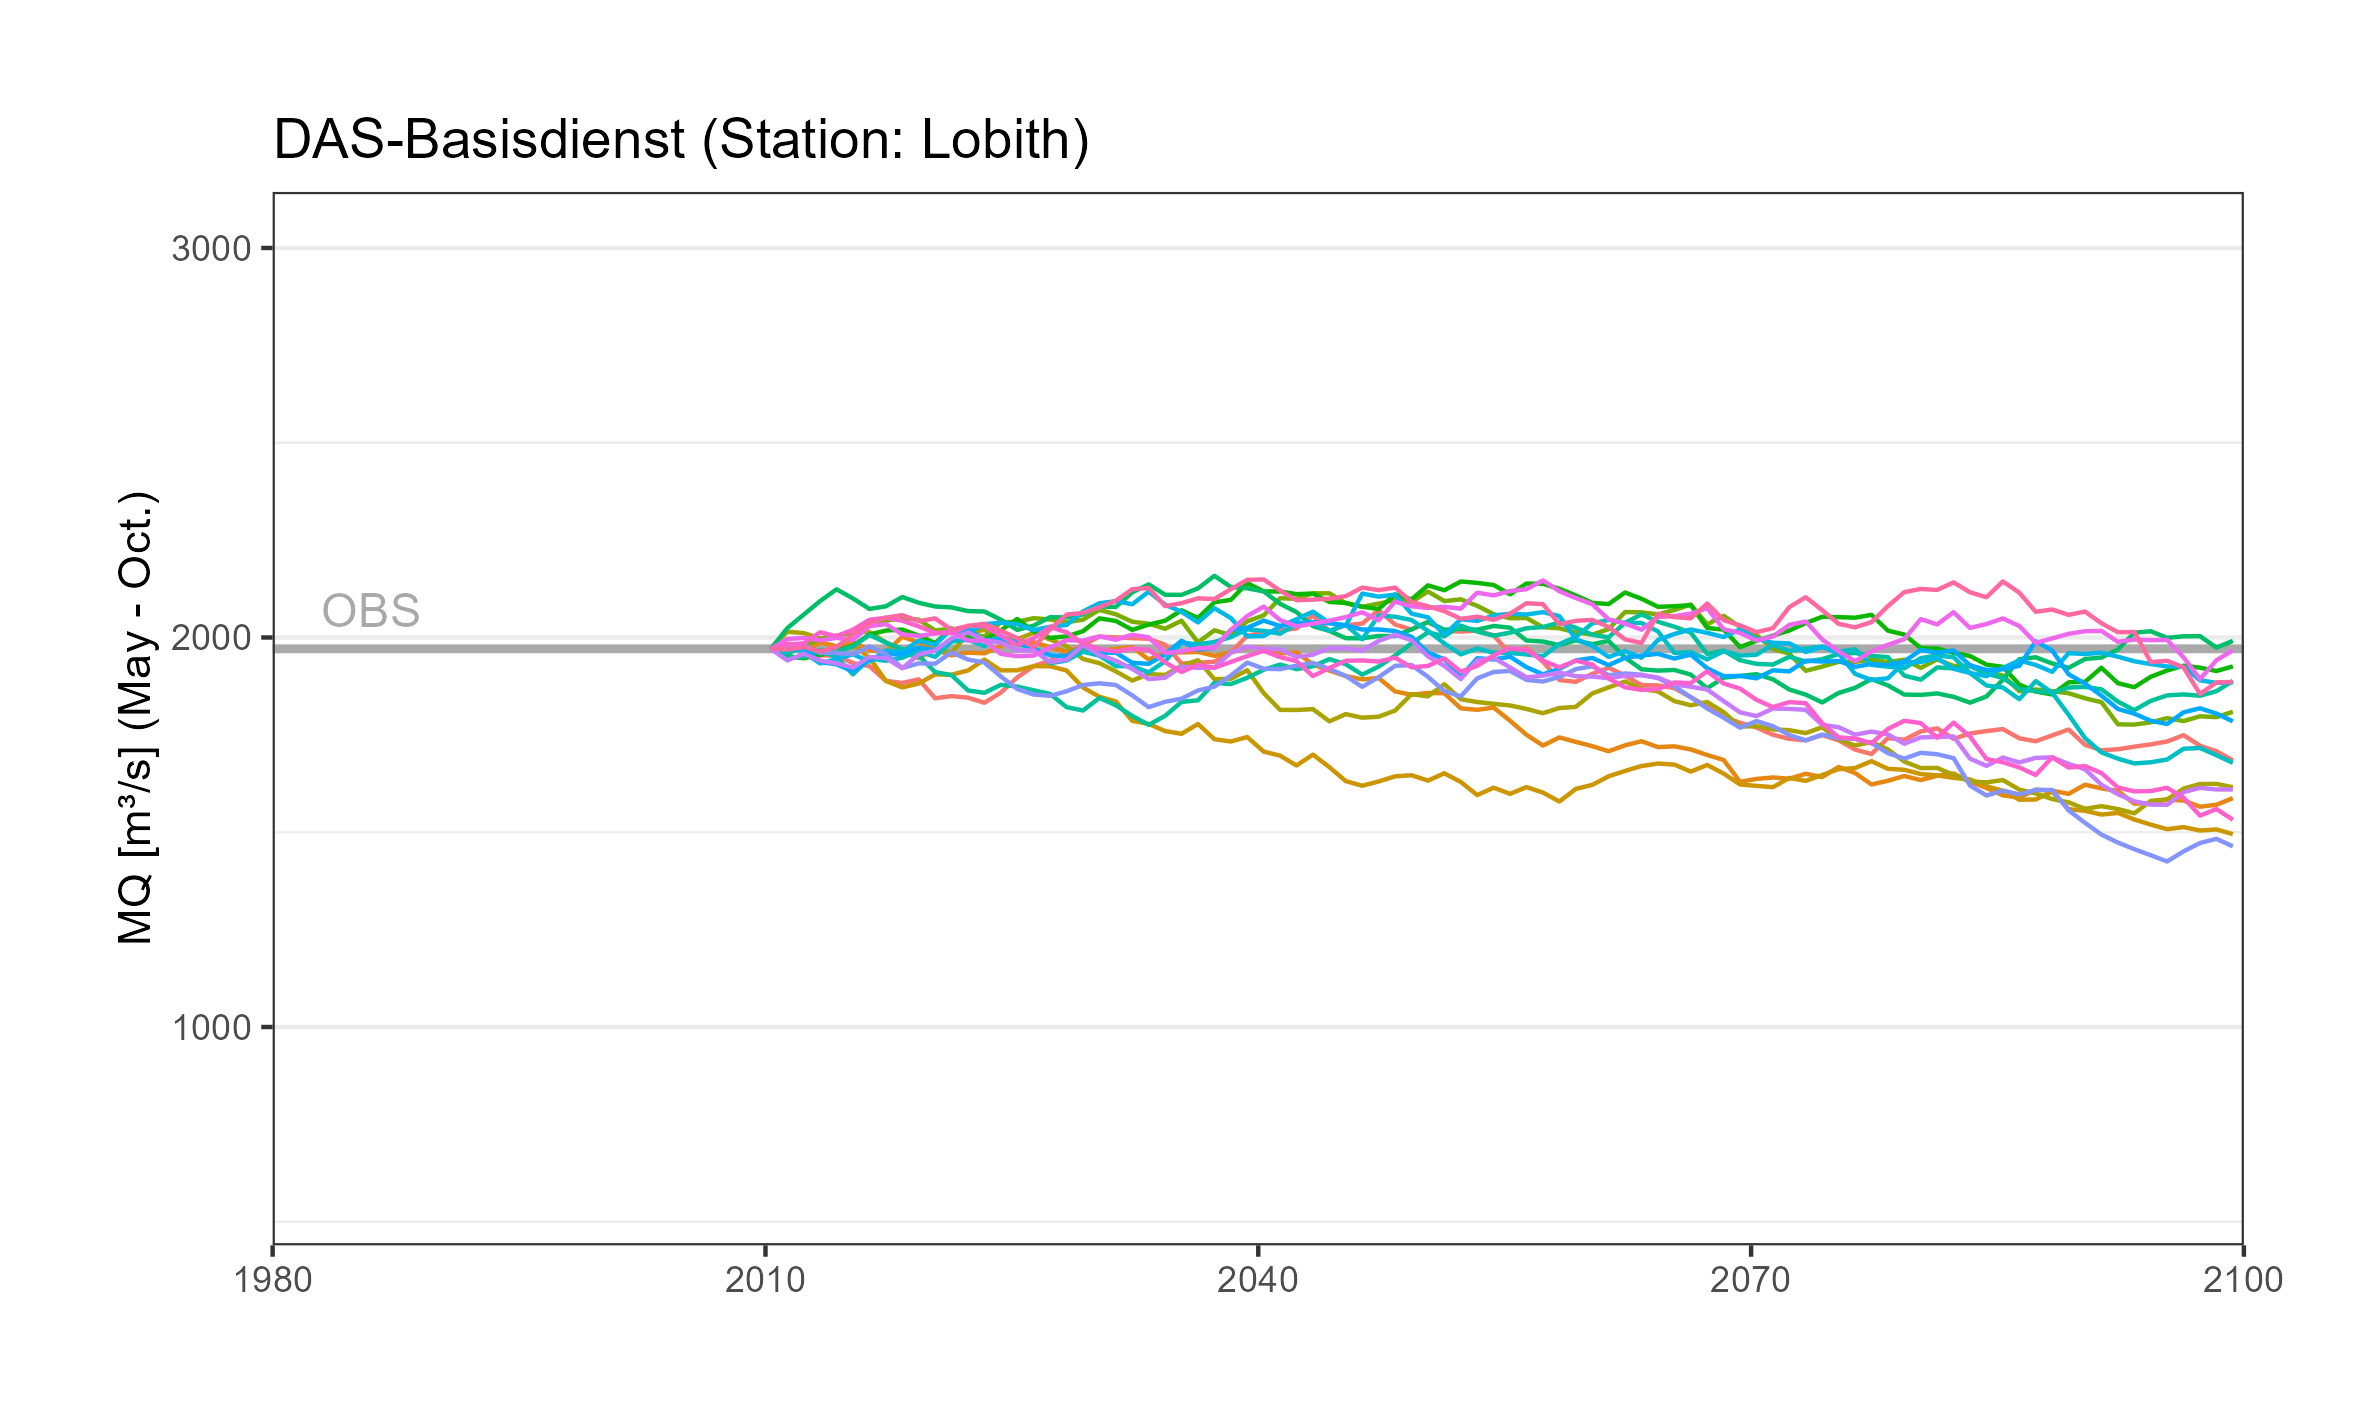
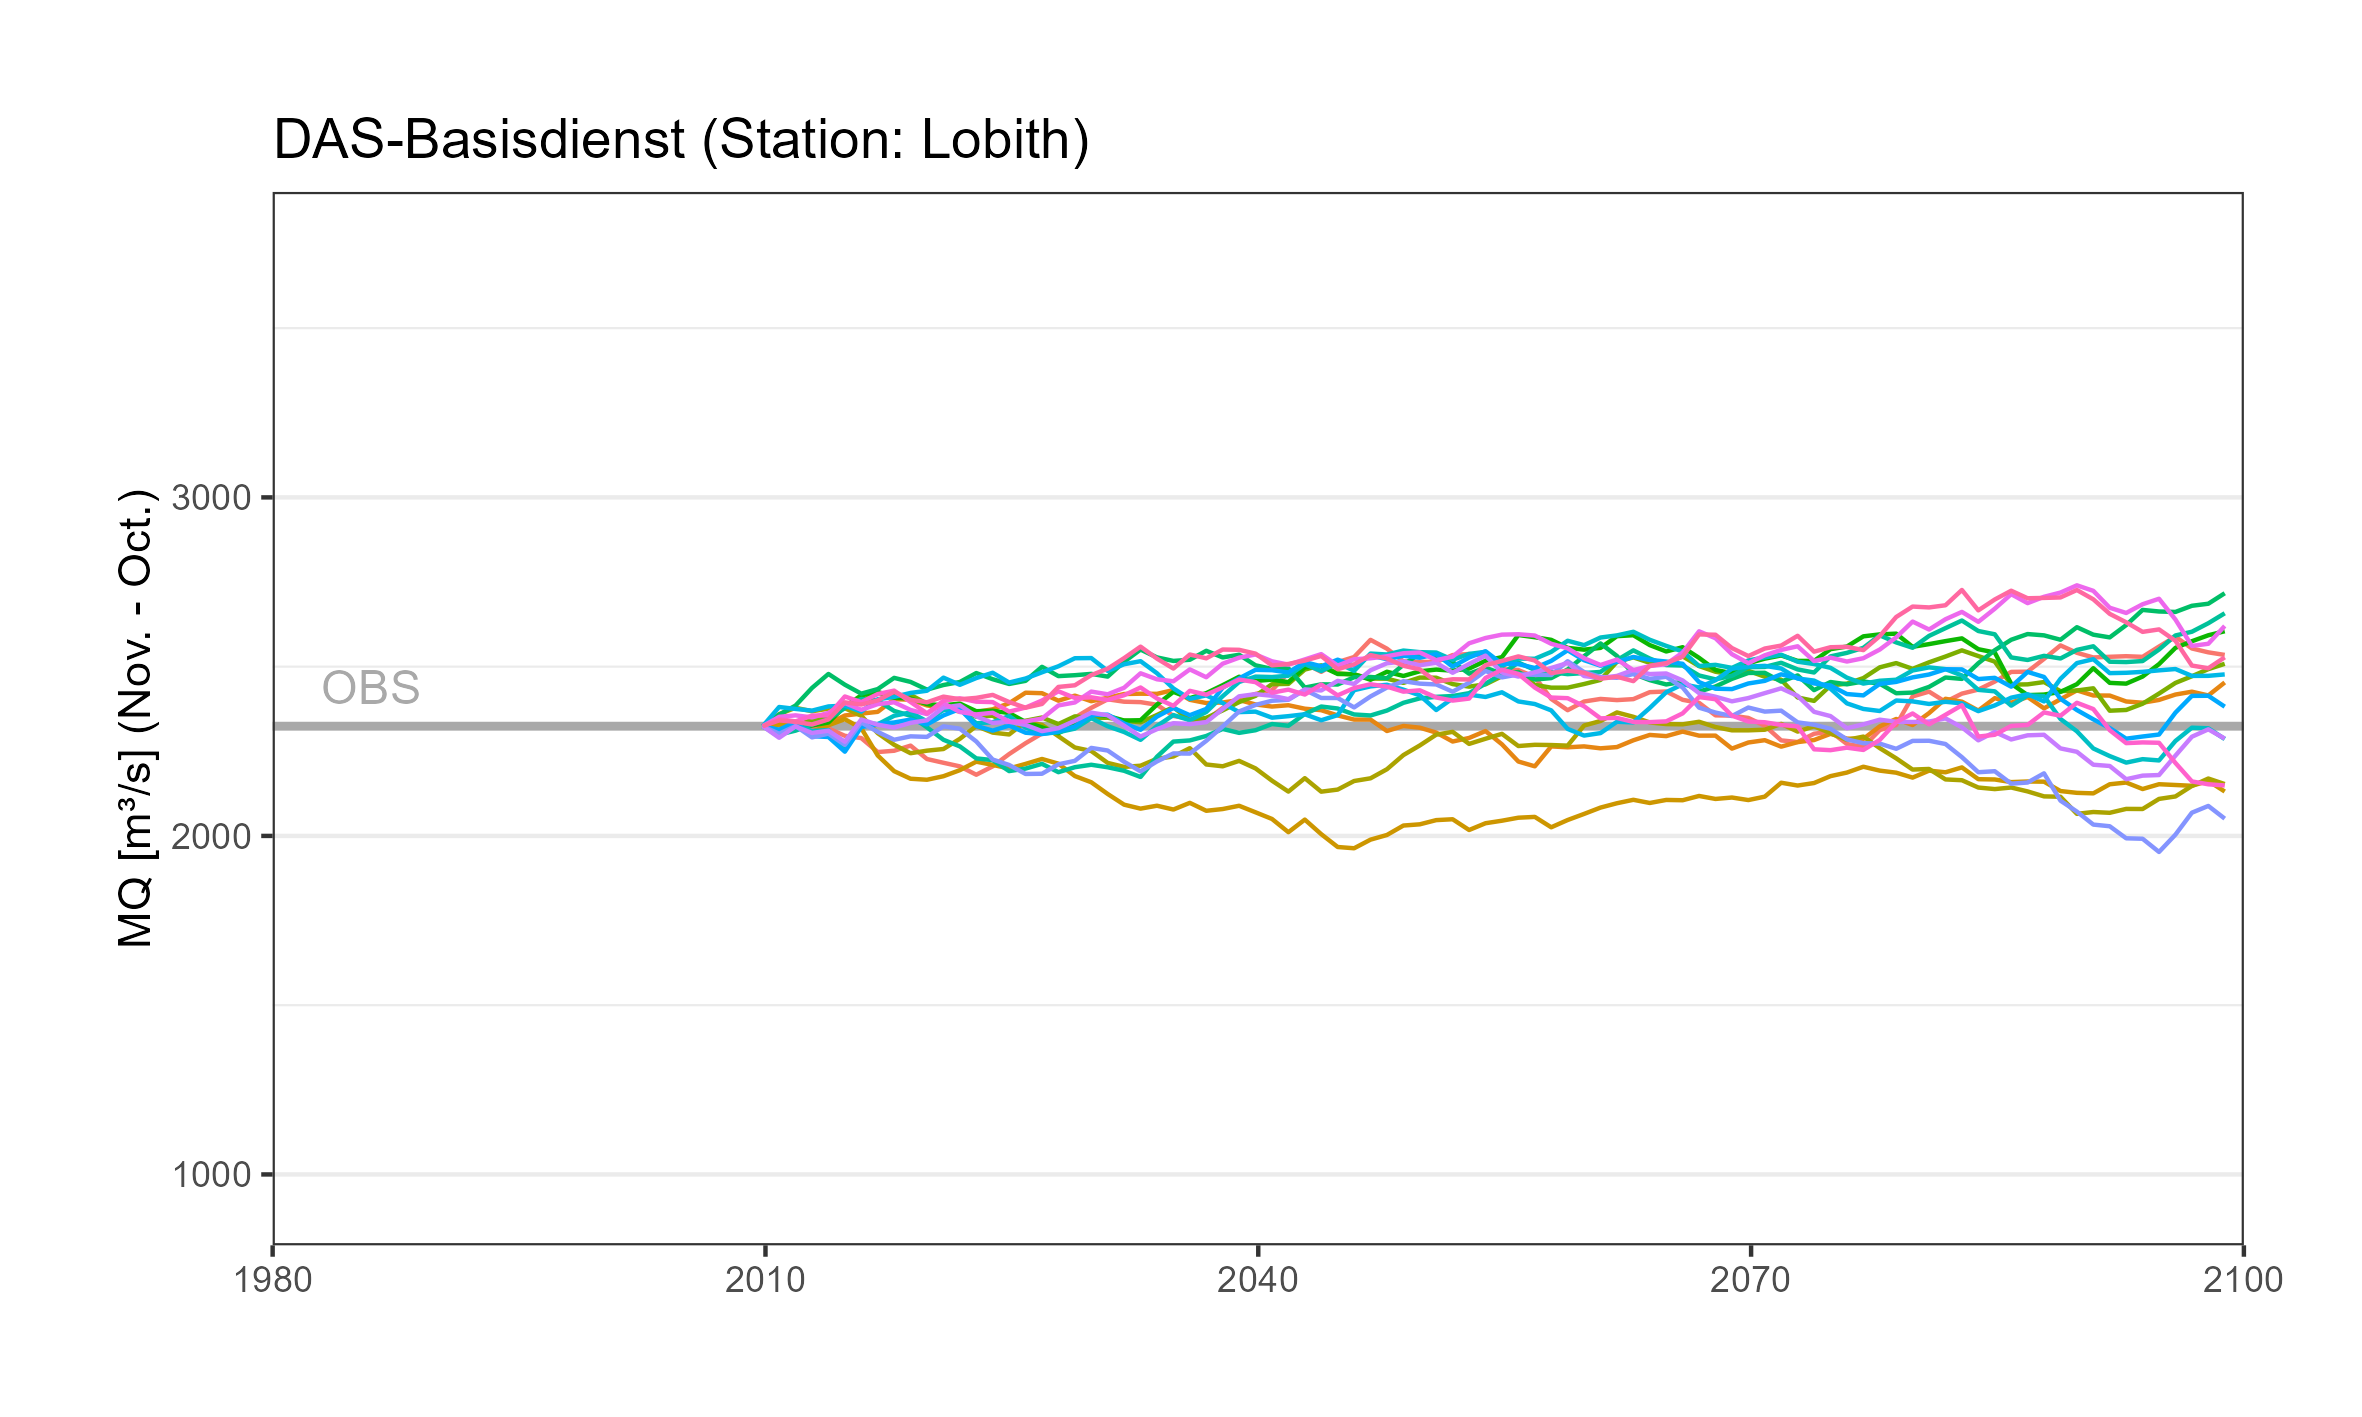
Lobith
Ensemble plot
Time series plot
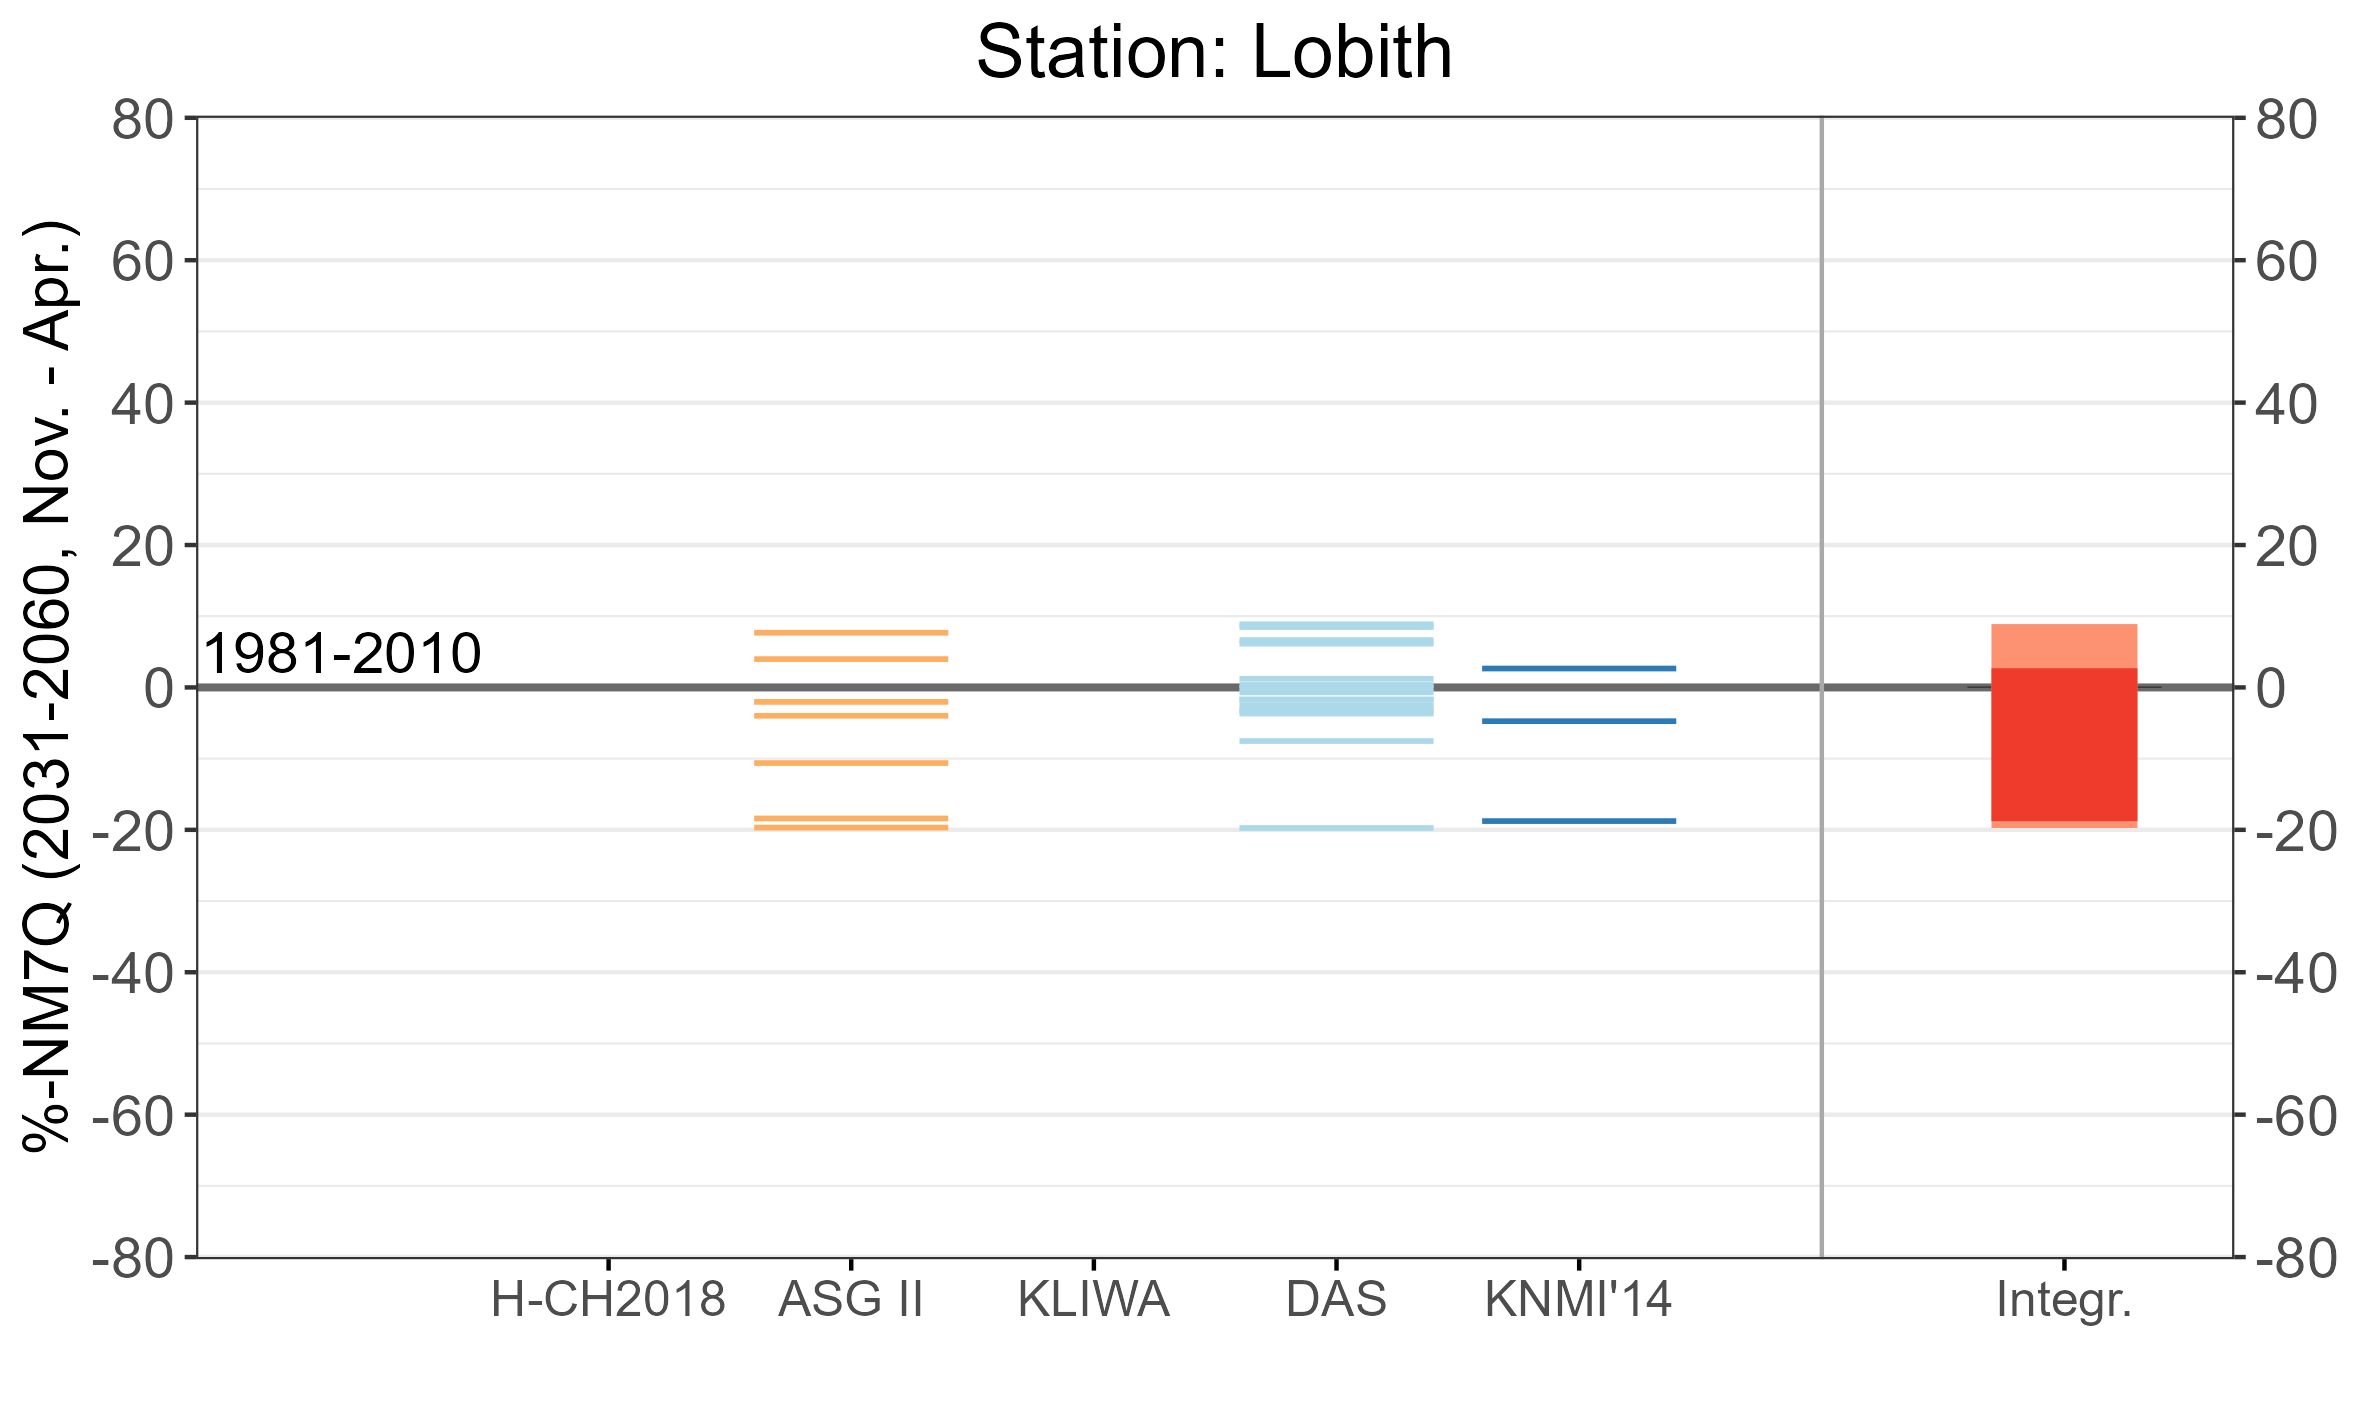
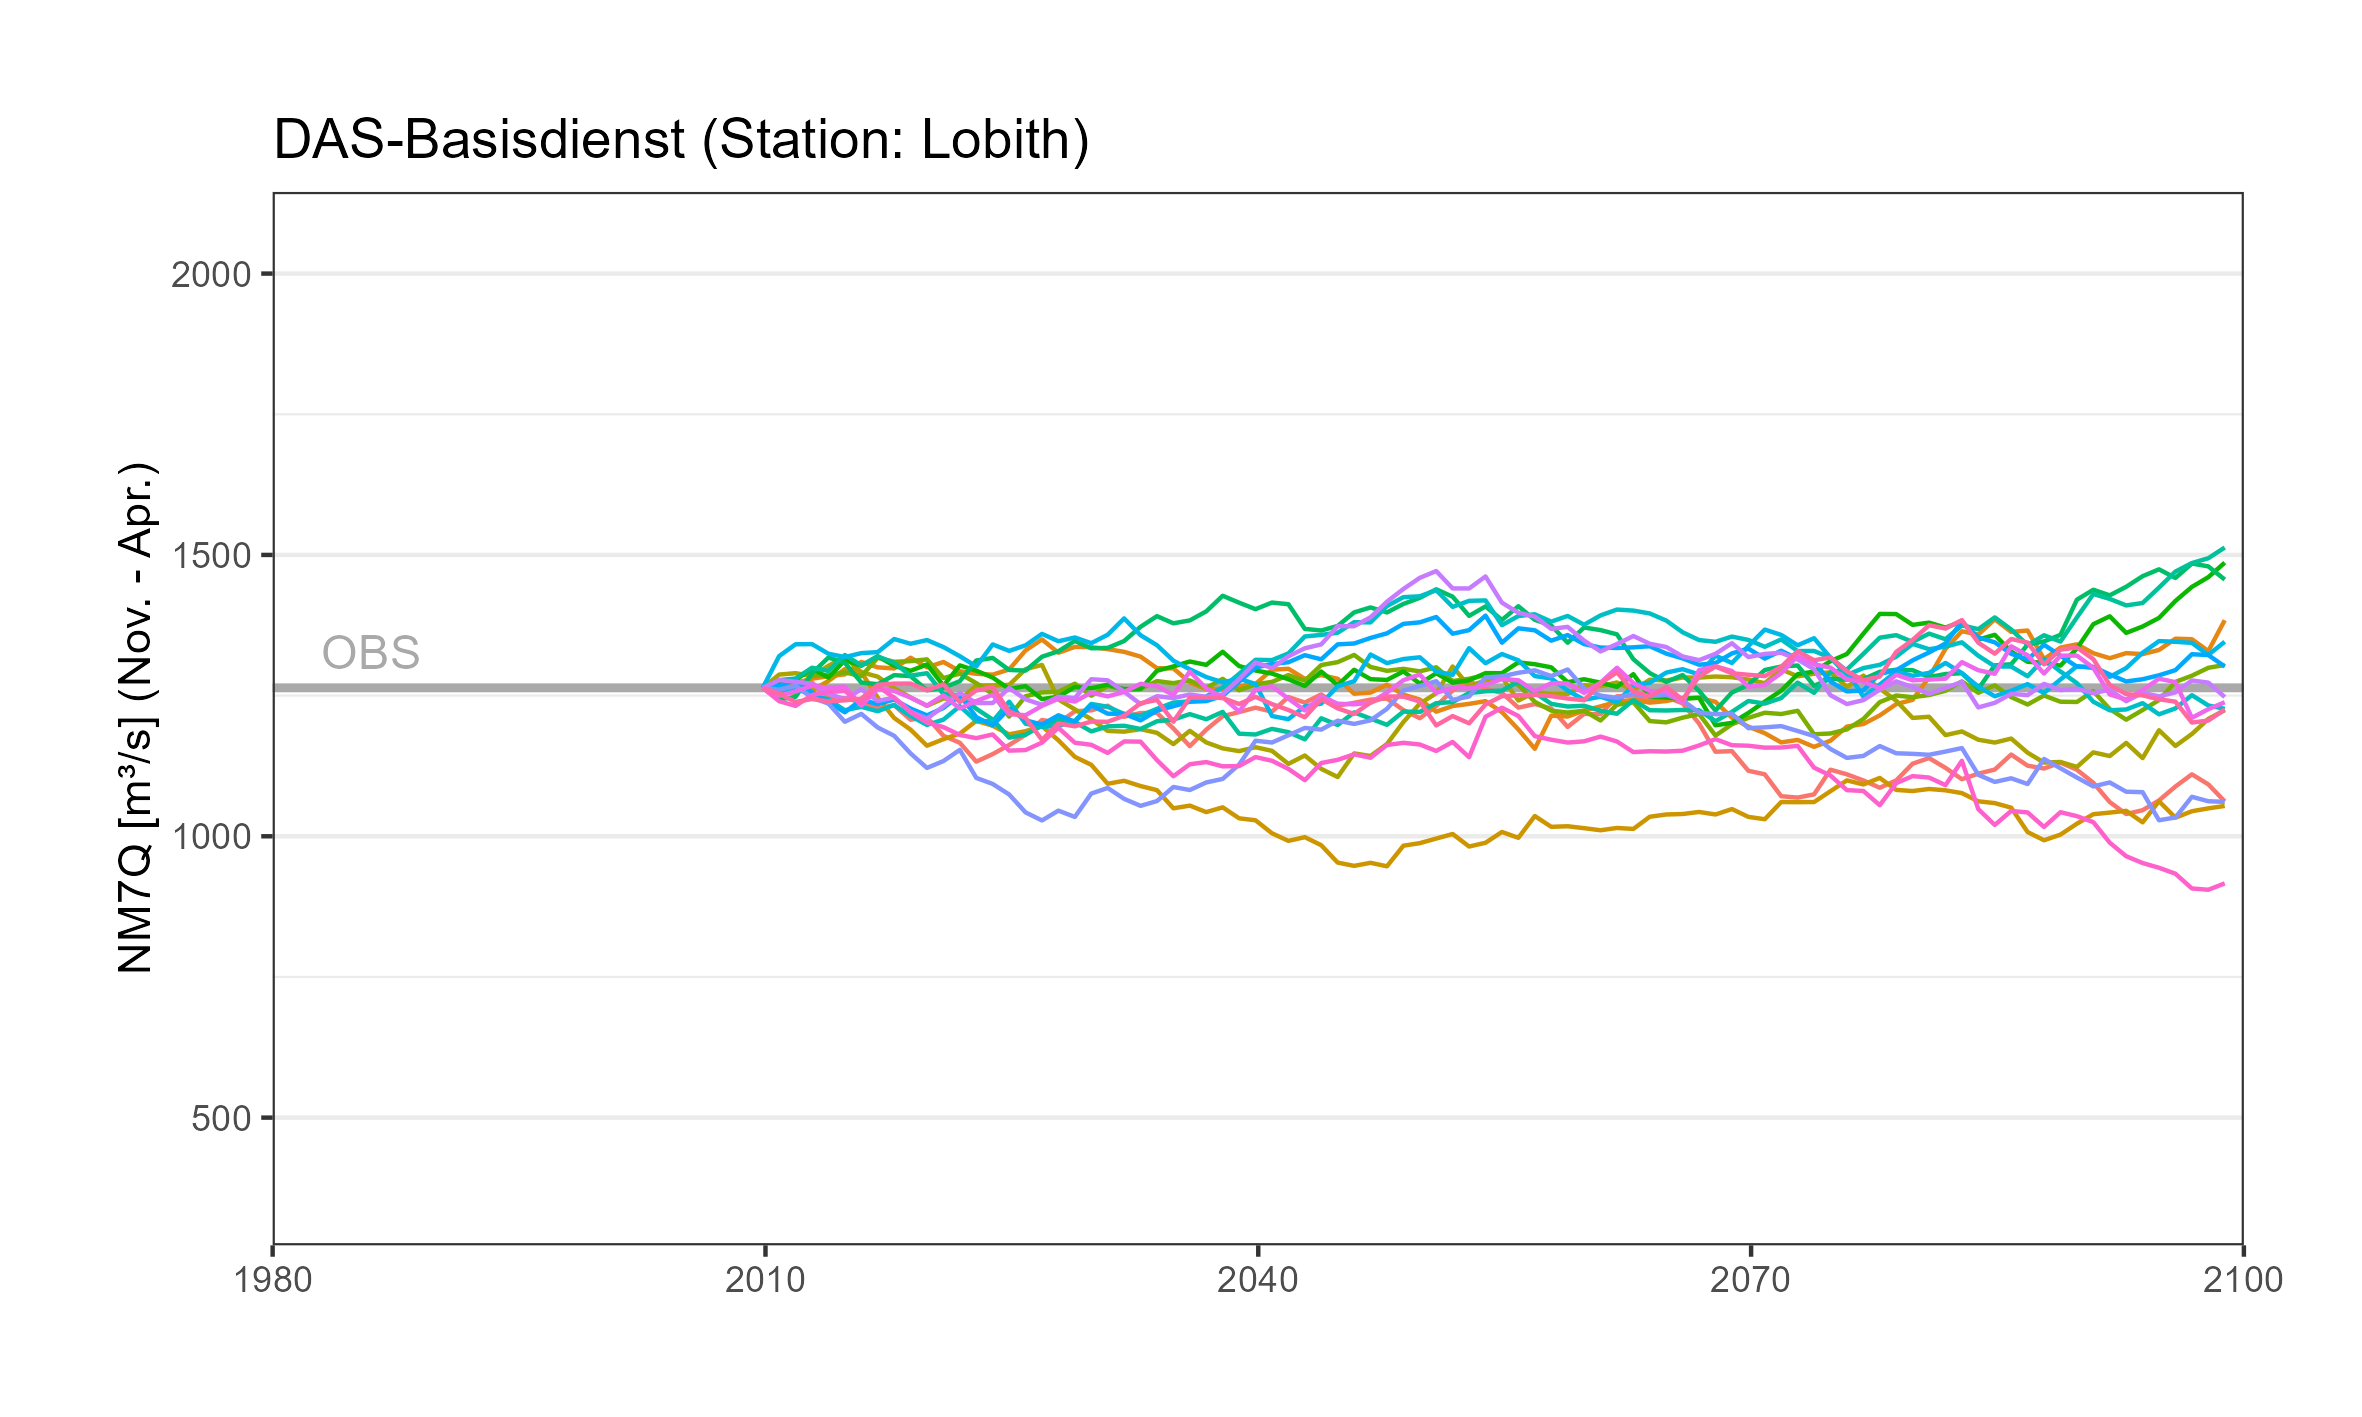
Lineplots_ASG2_Lobith_NM7Q_hydrolYear_winter.png [151.43 KB]
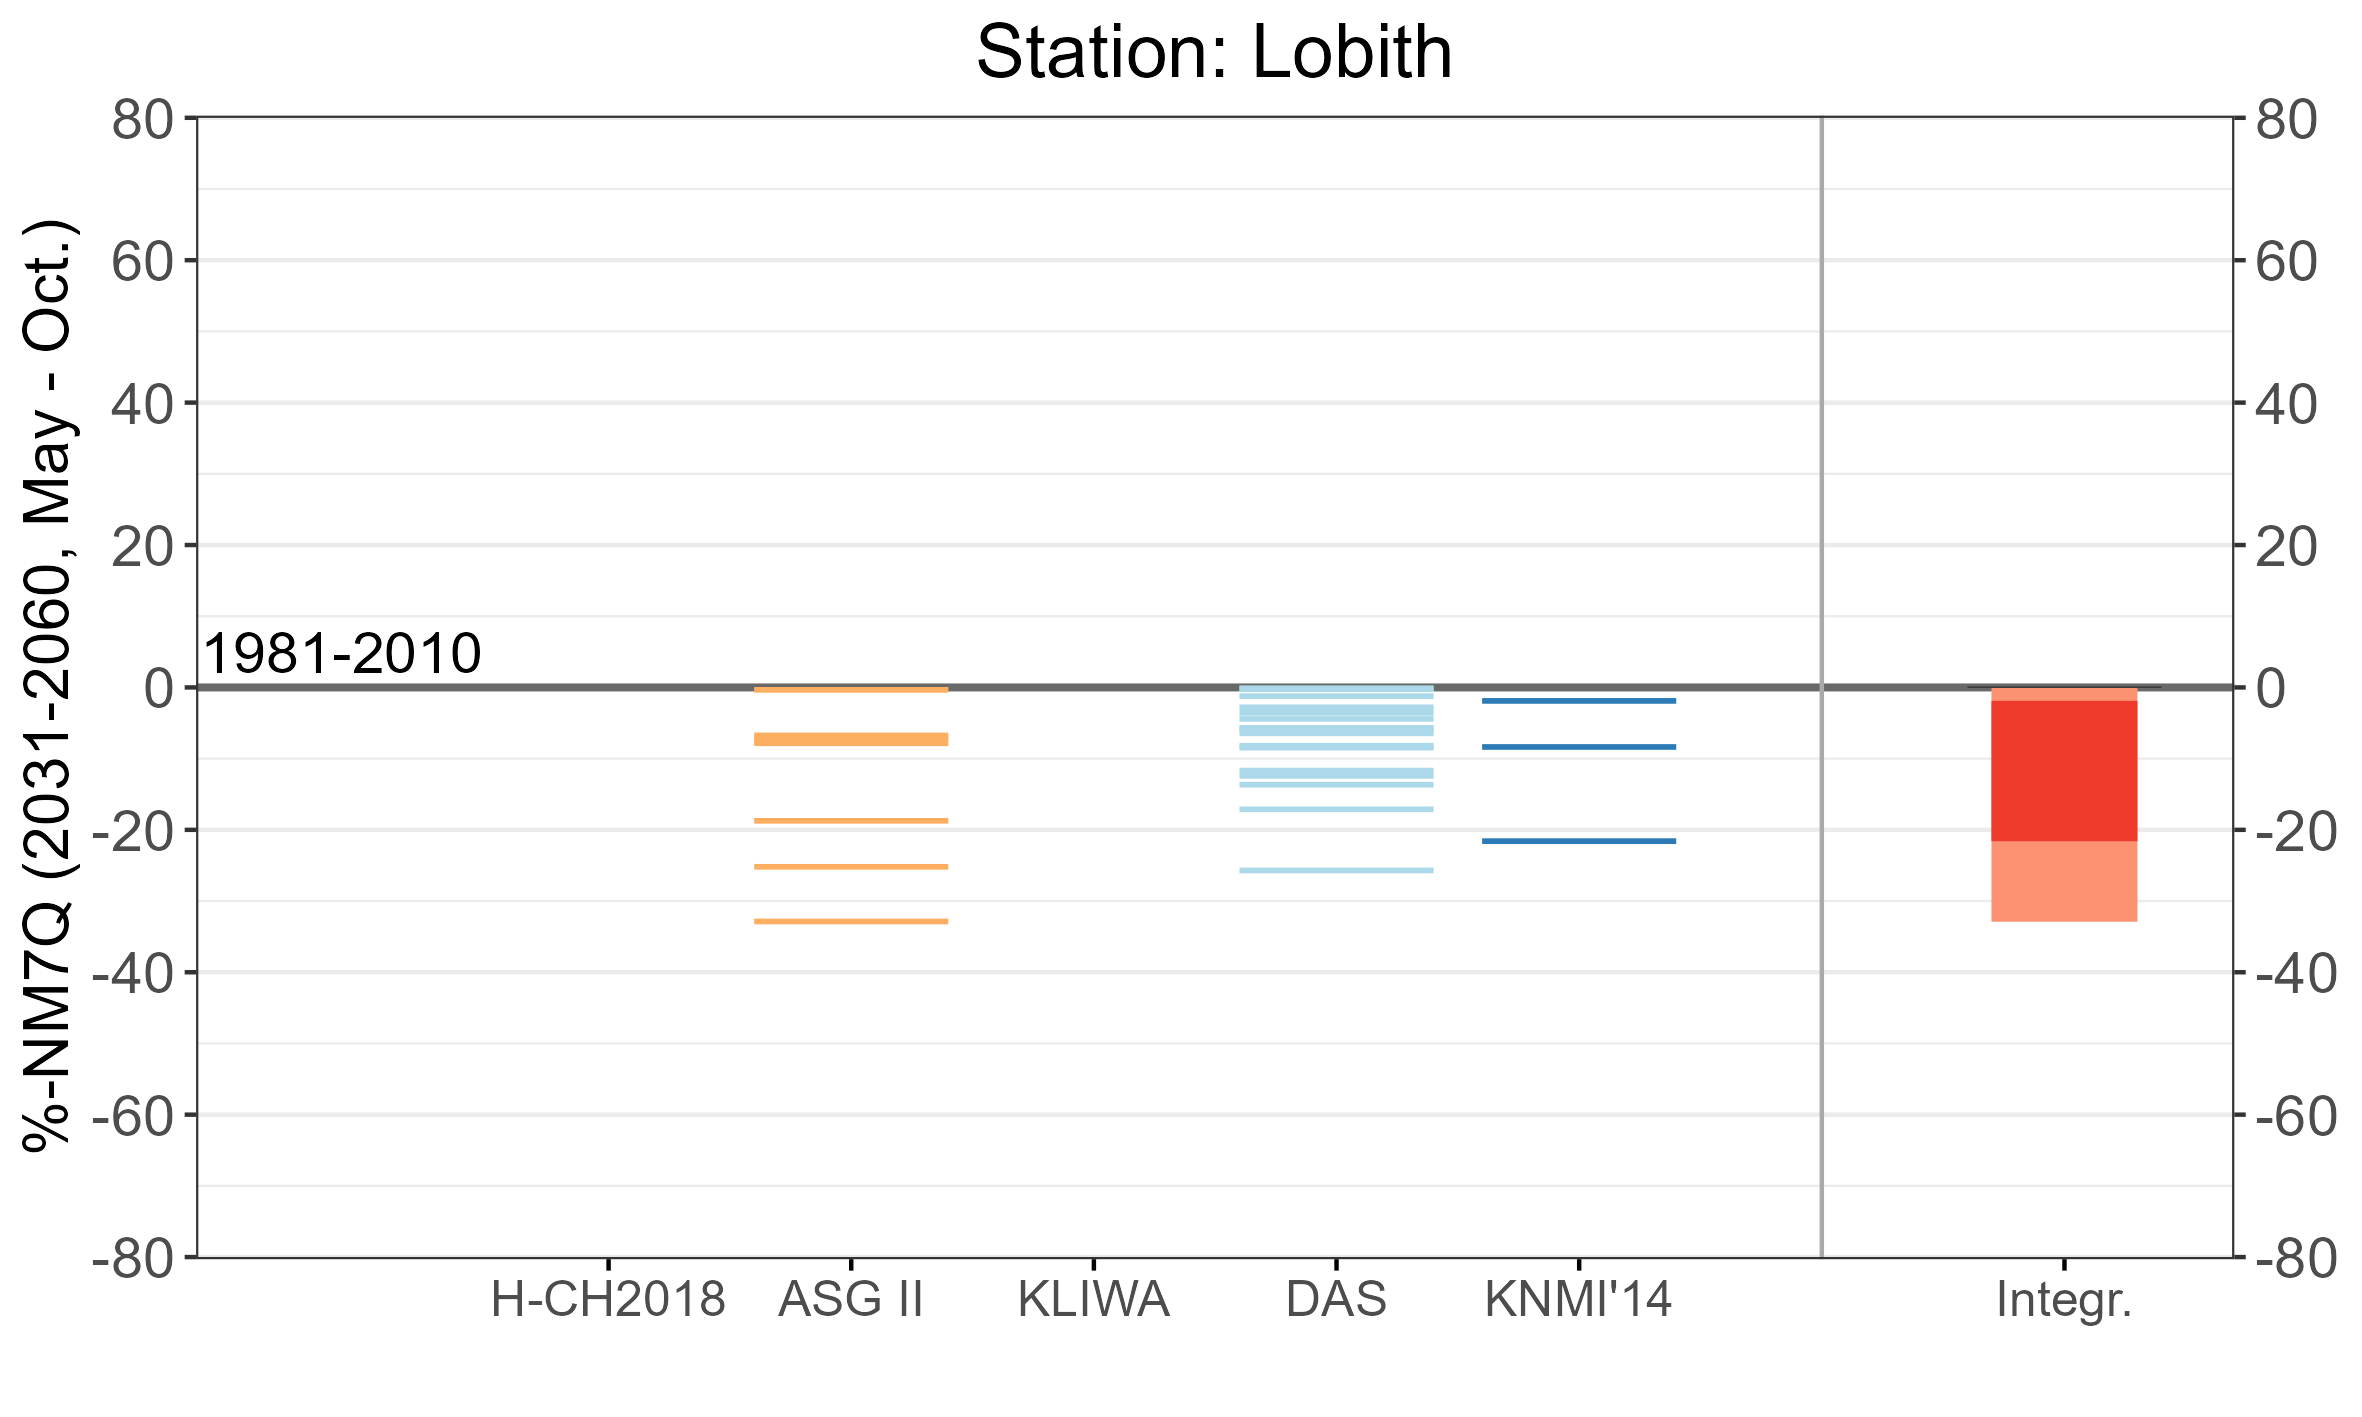
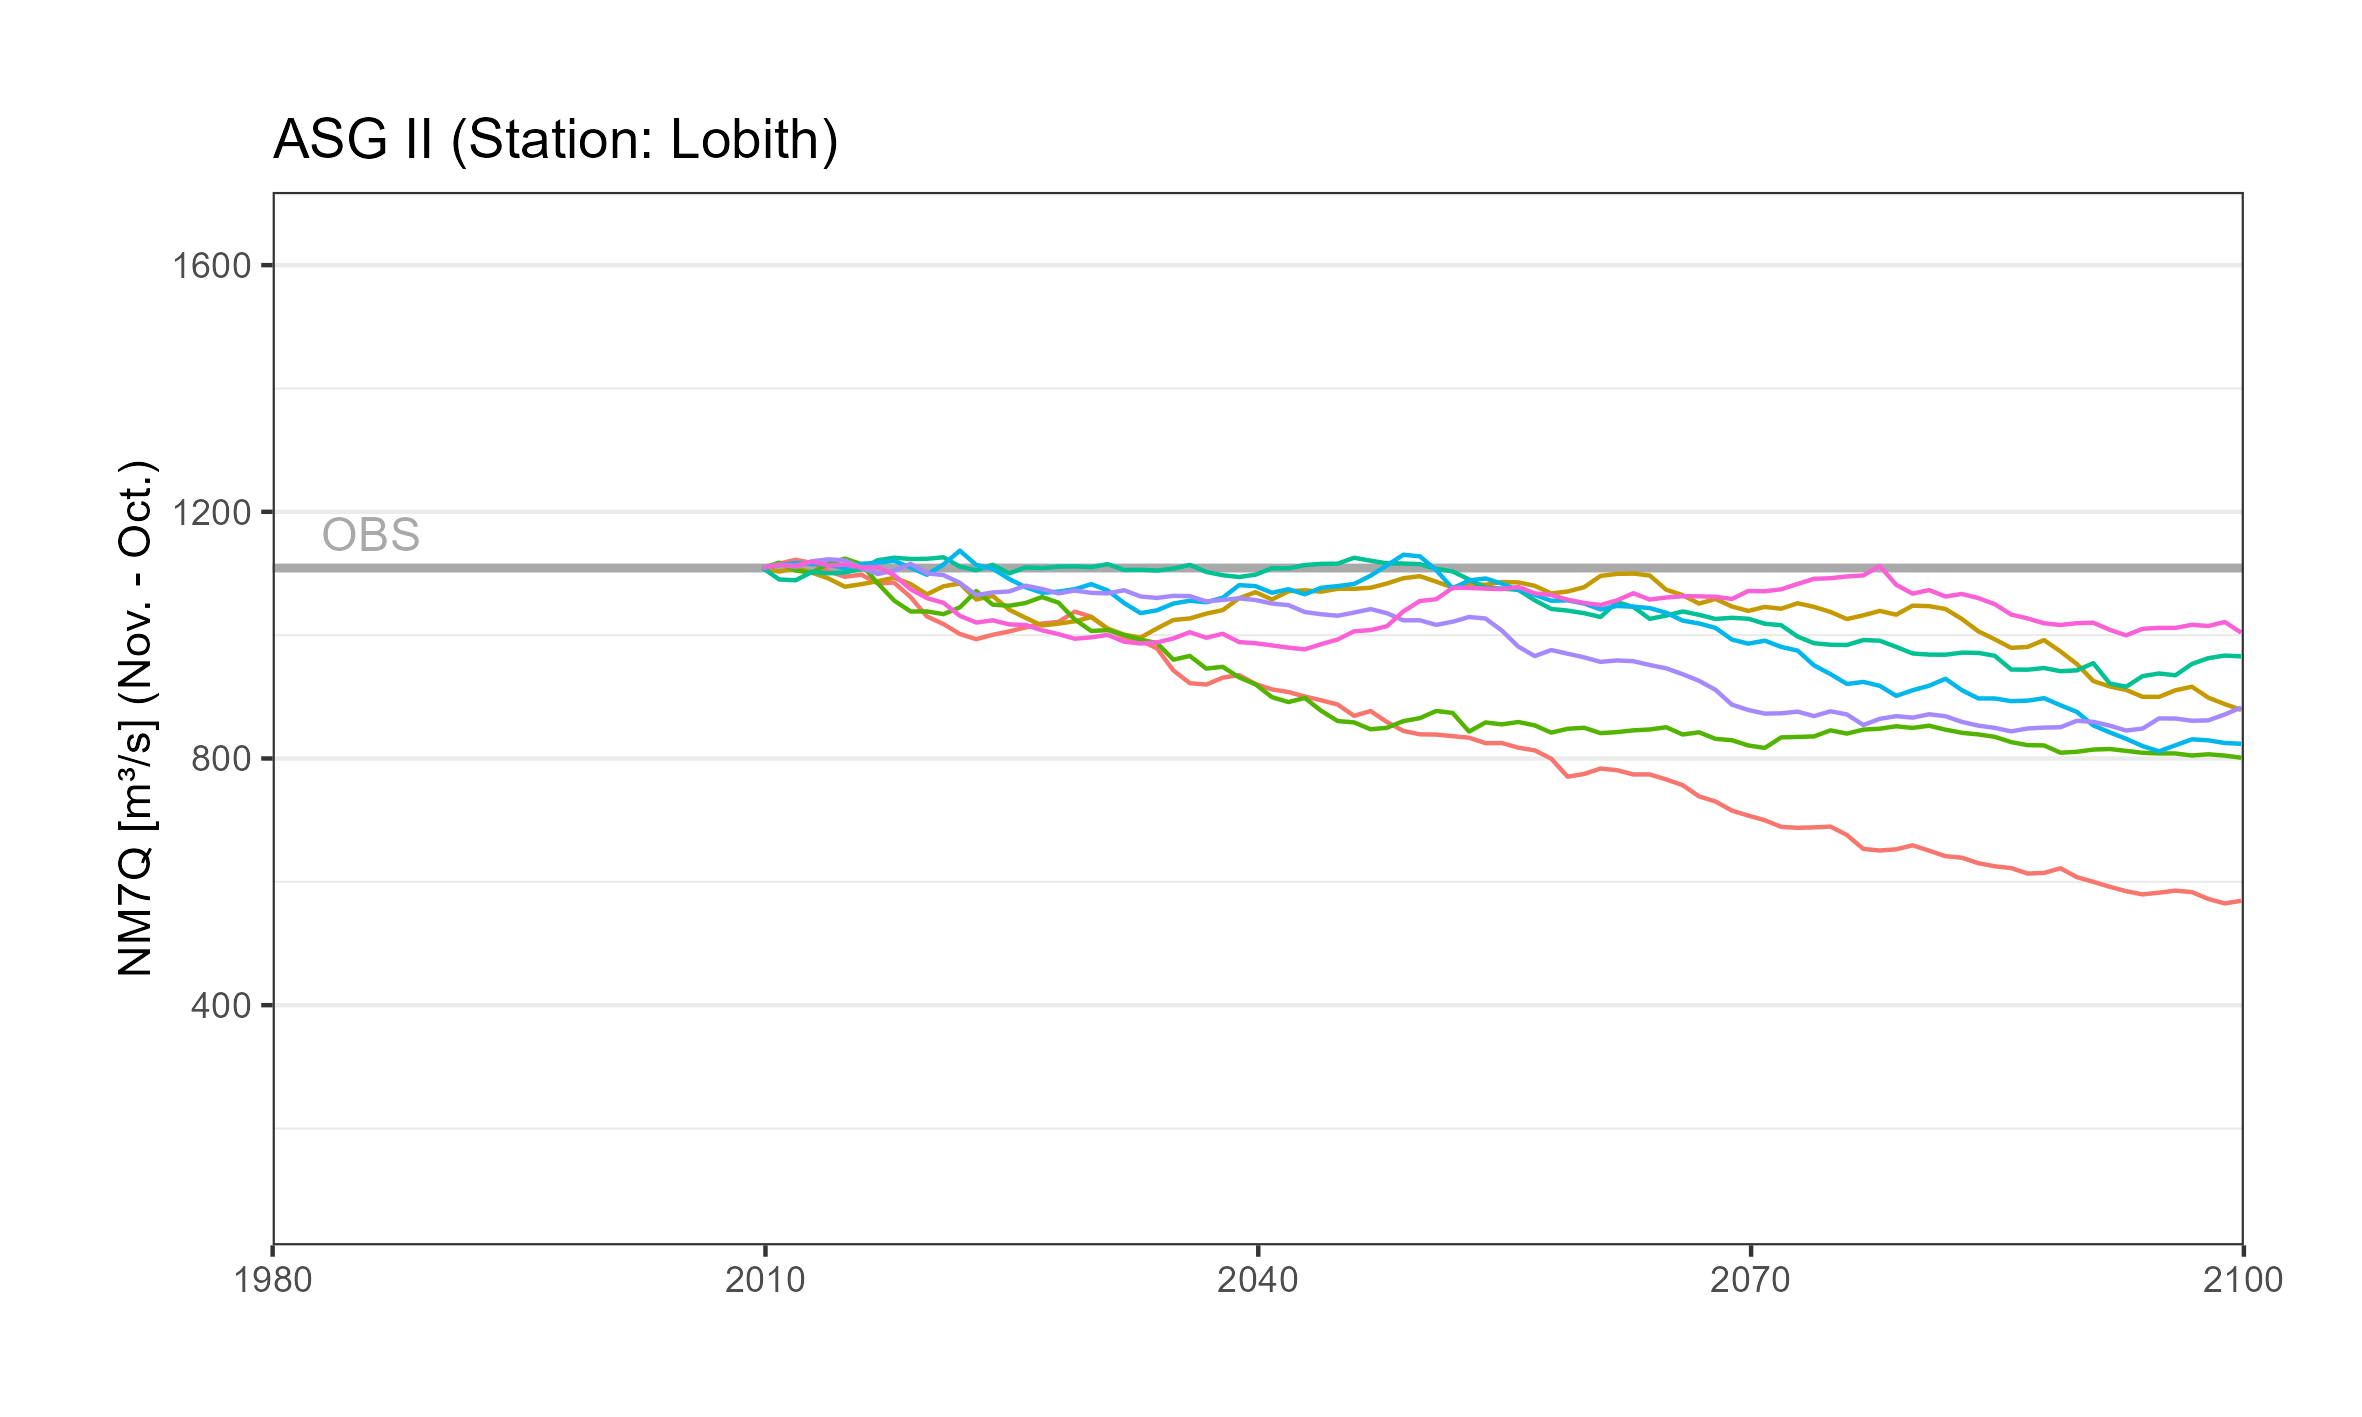
Lineplots_ASG2_Lobith_NM7Q_hydrolYear_summer.png [138.52 KB]
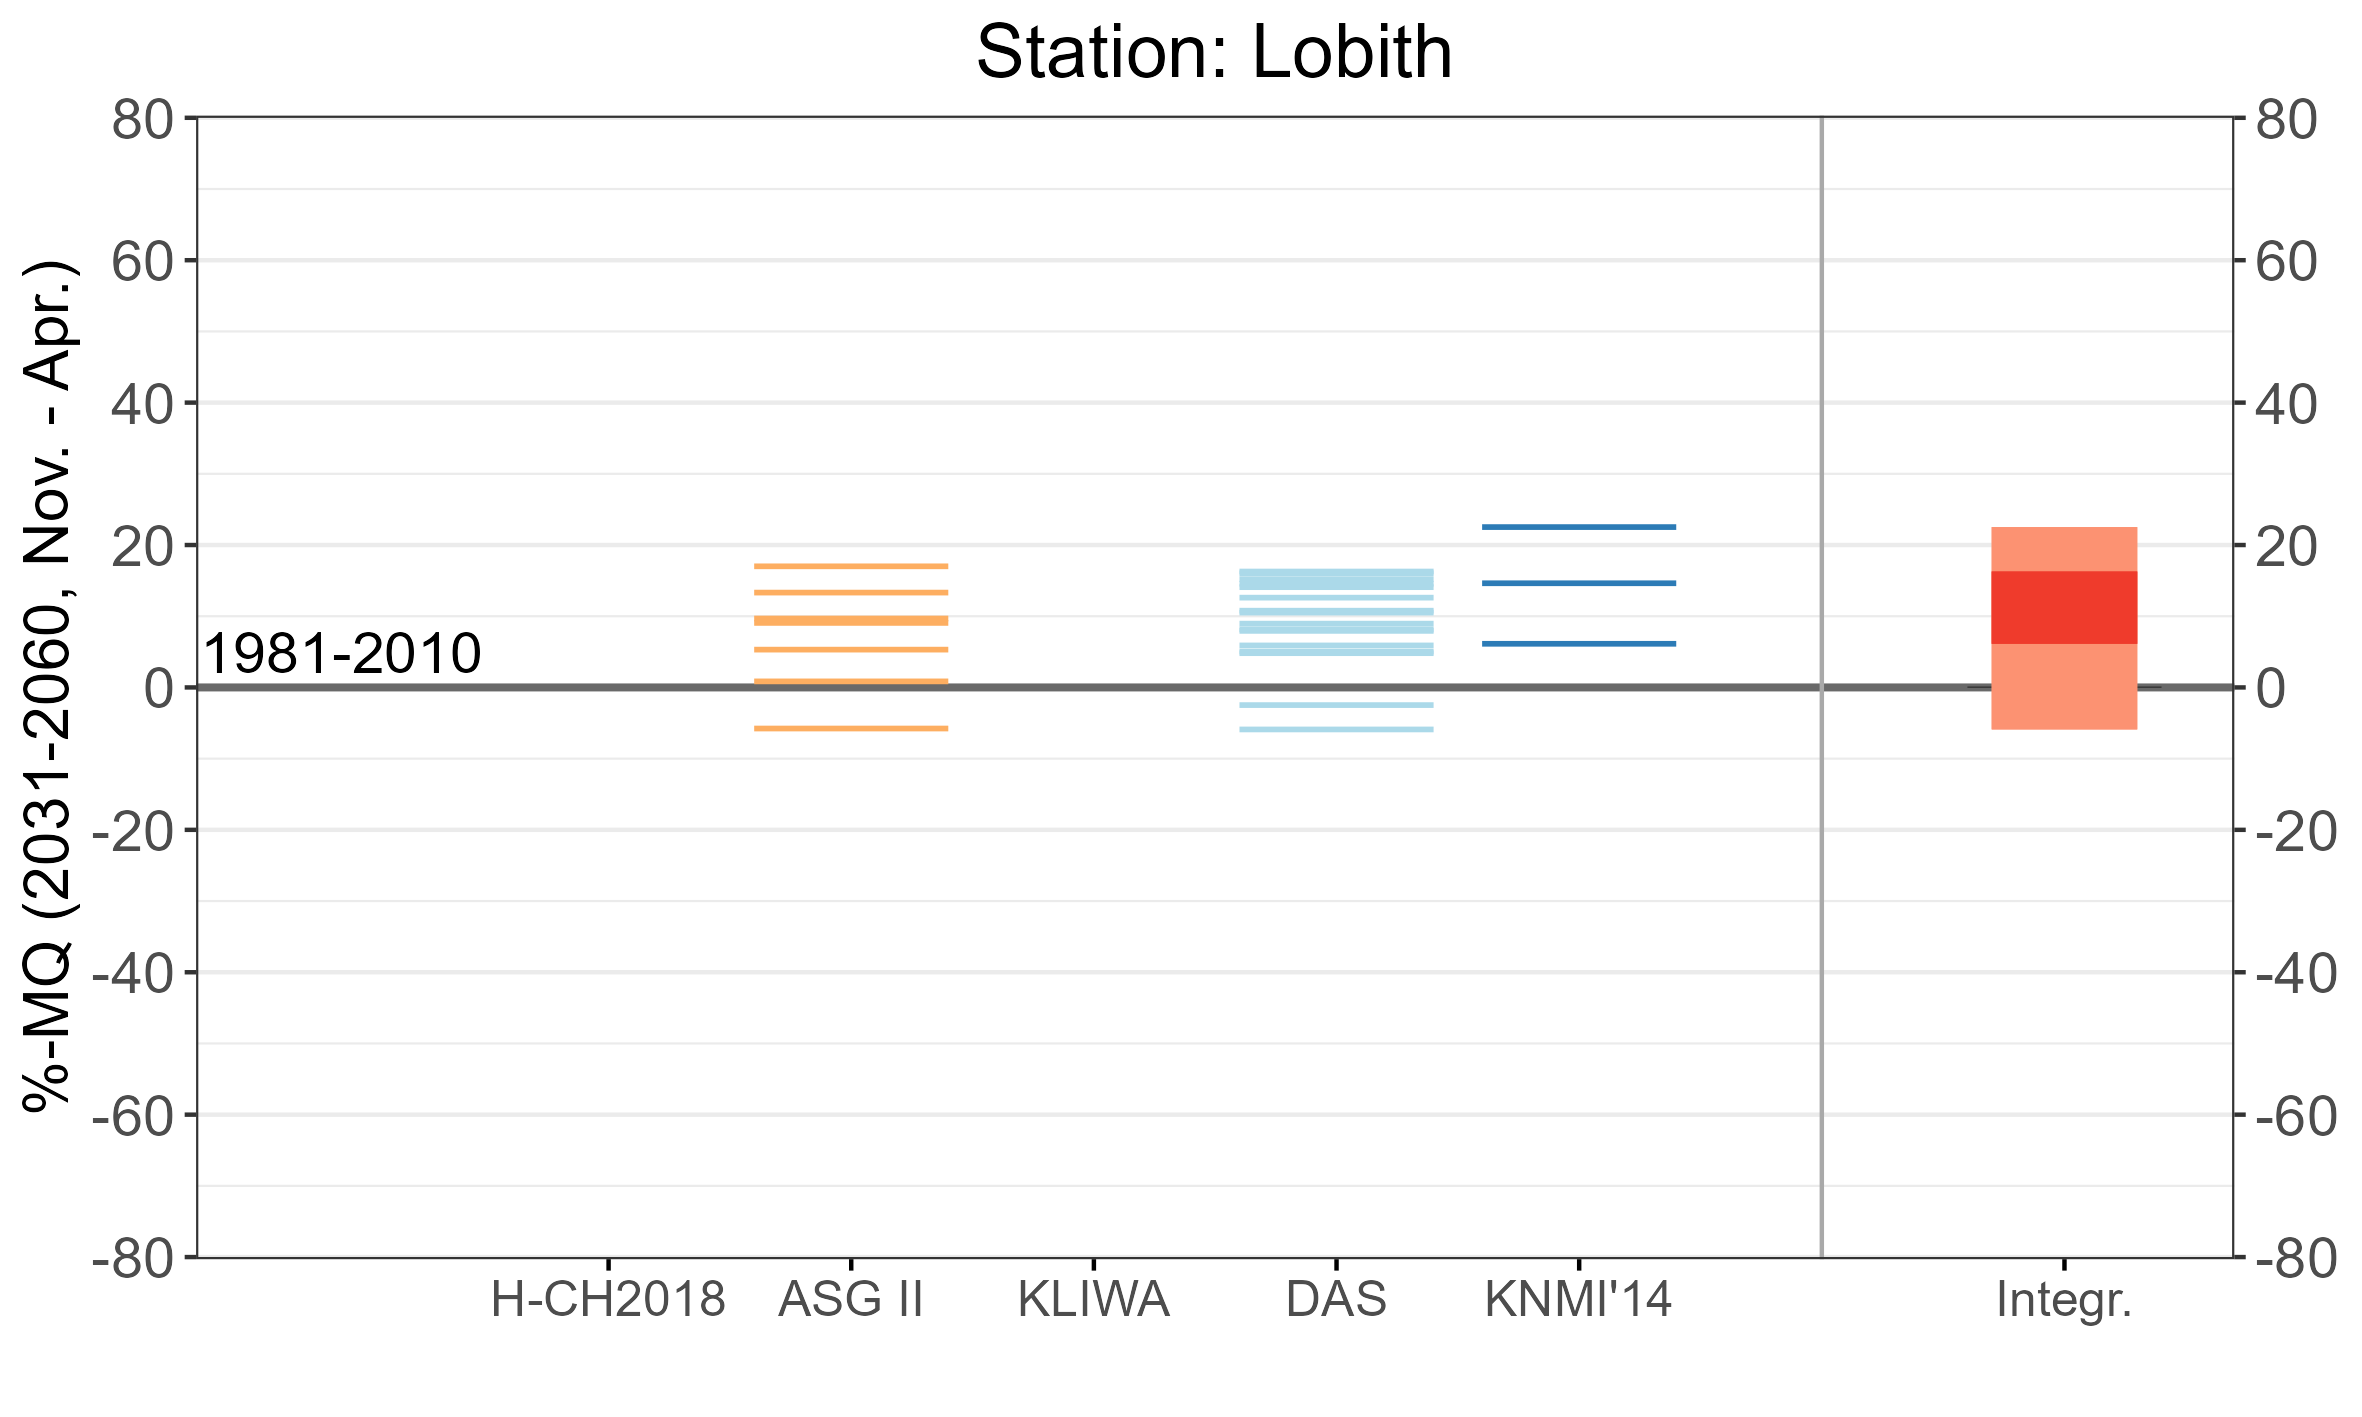
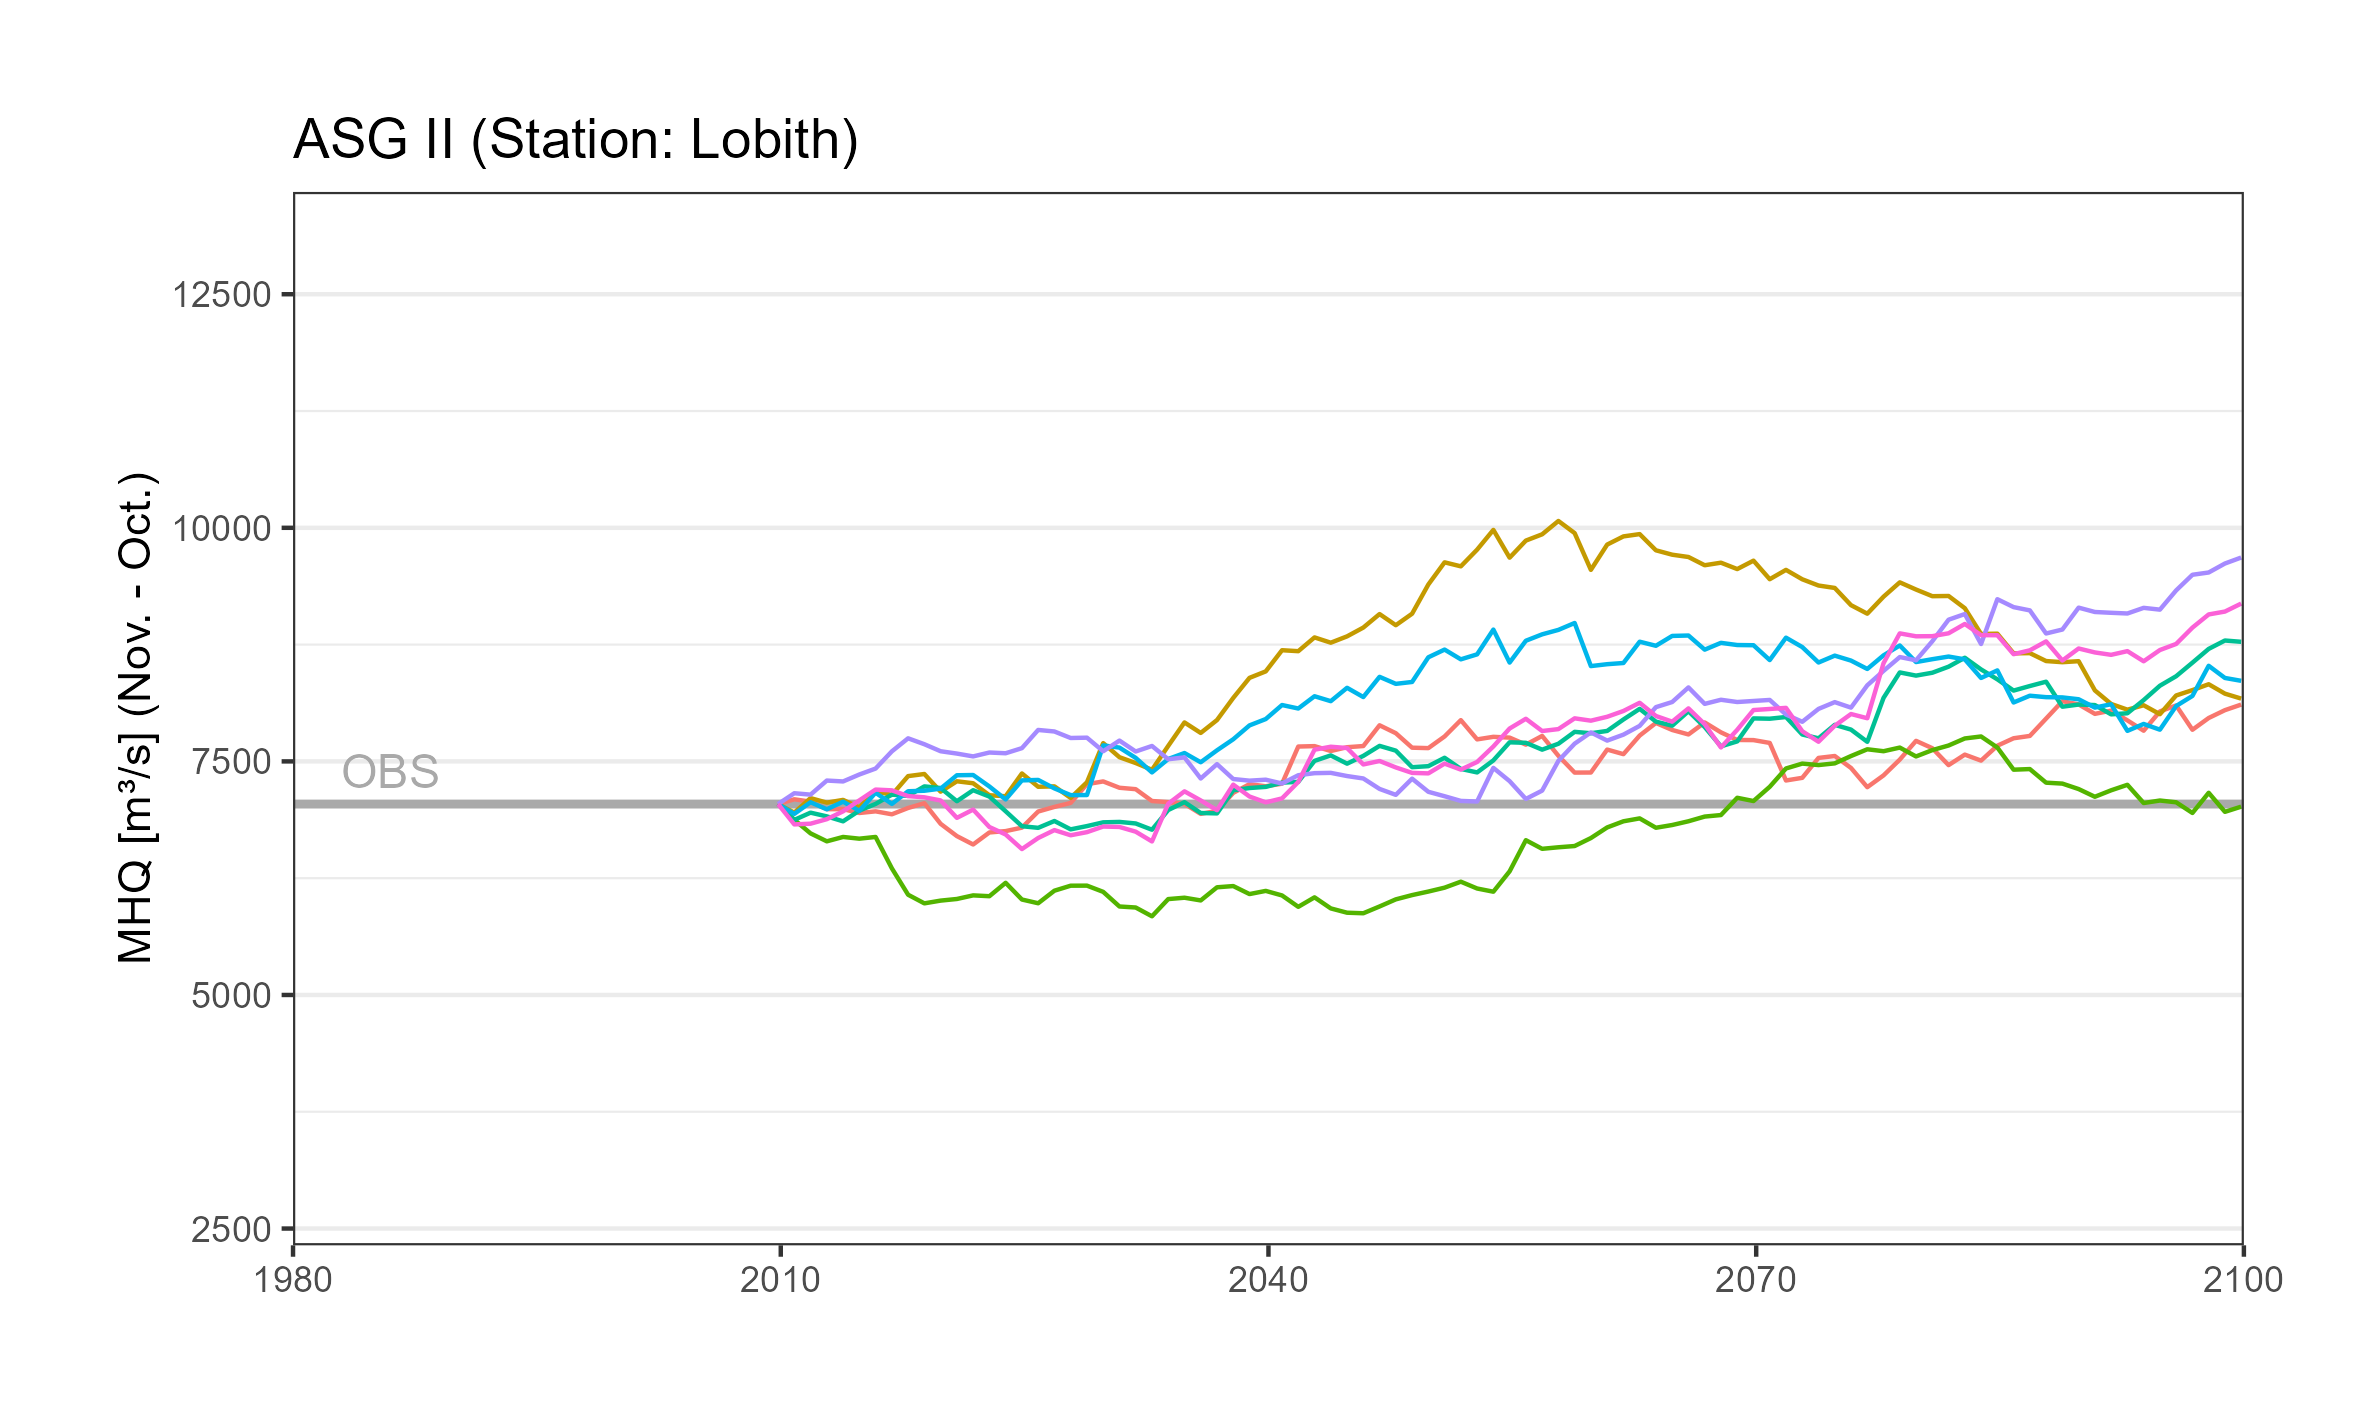
Lineplots_ASG2_Lobith_MQ_hydrolYear_winter.png [157.77 KB]
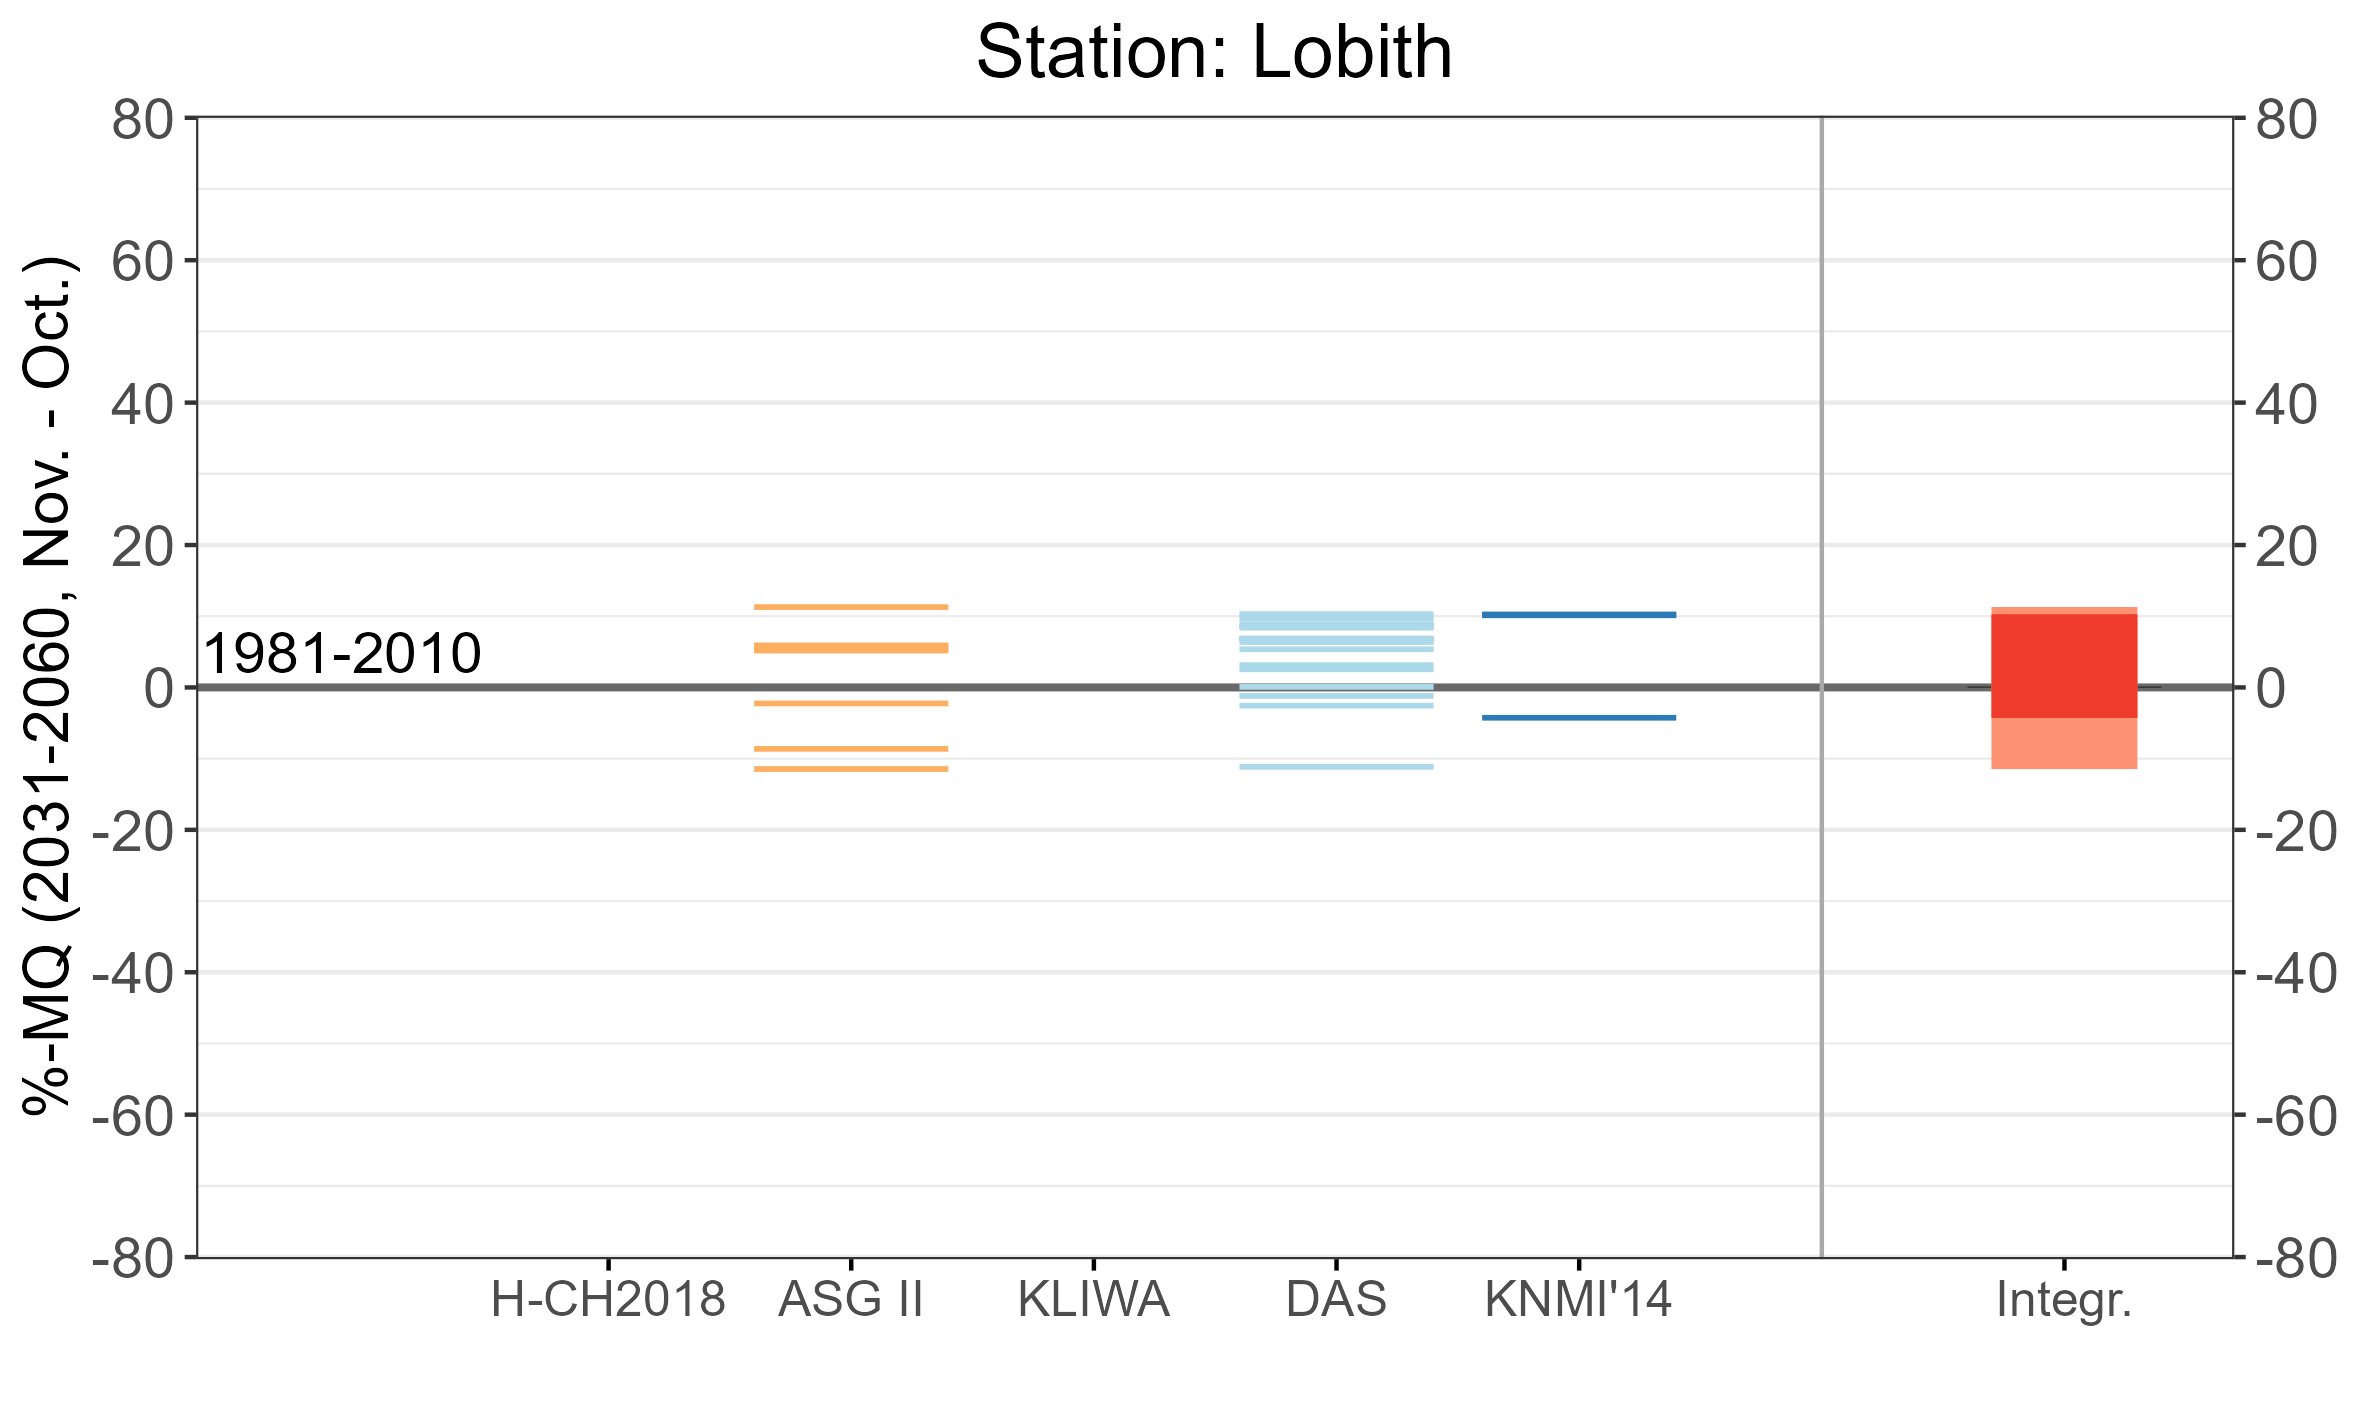
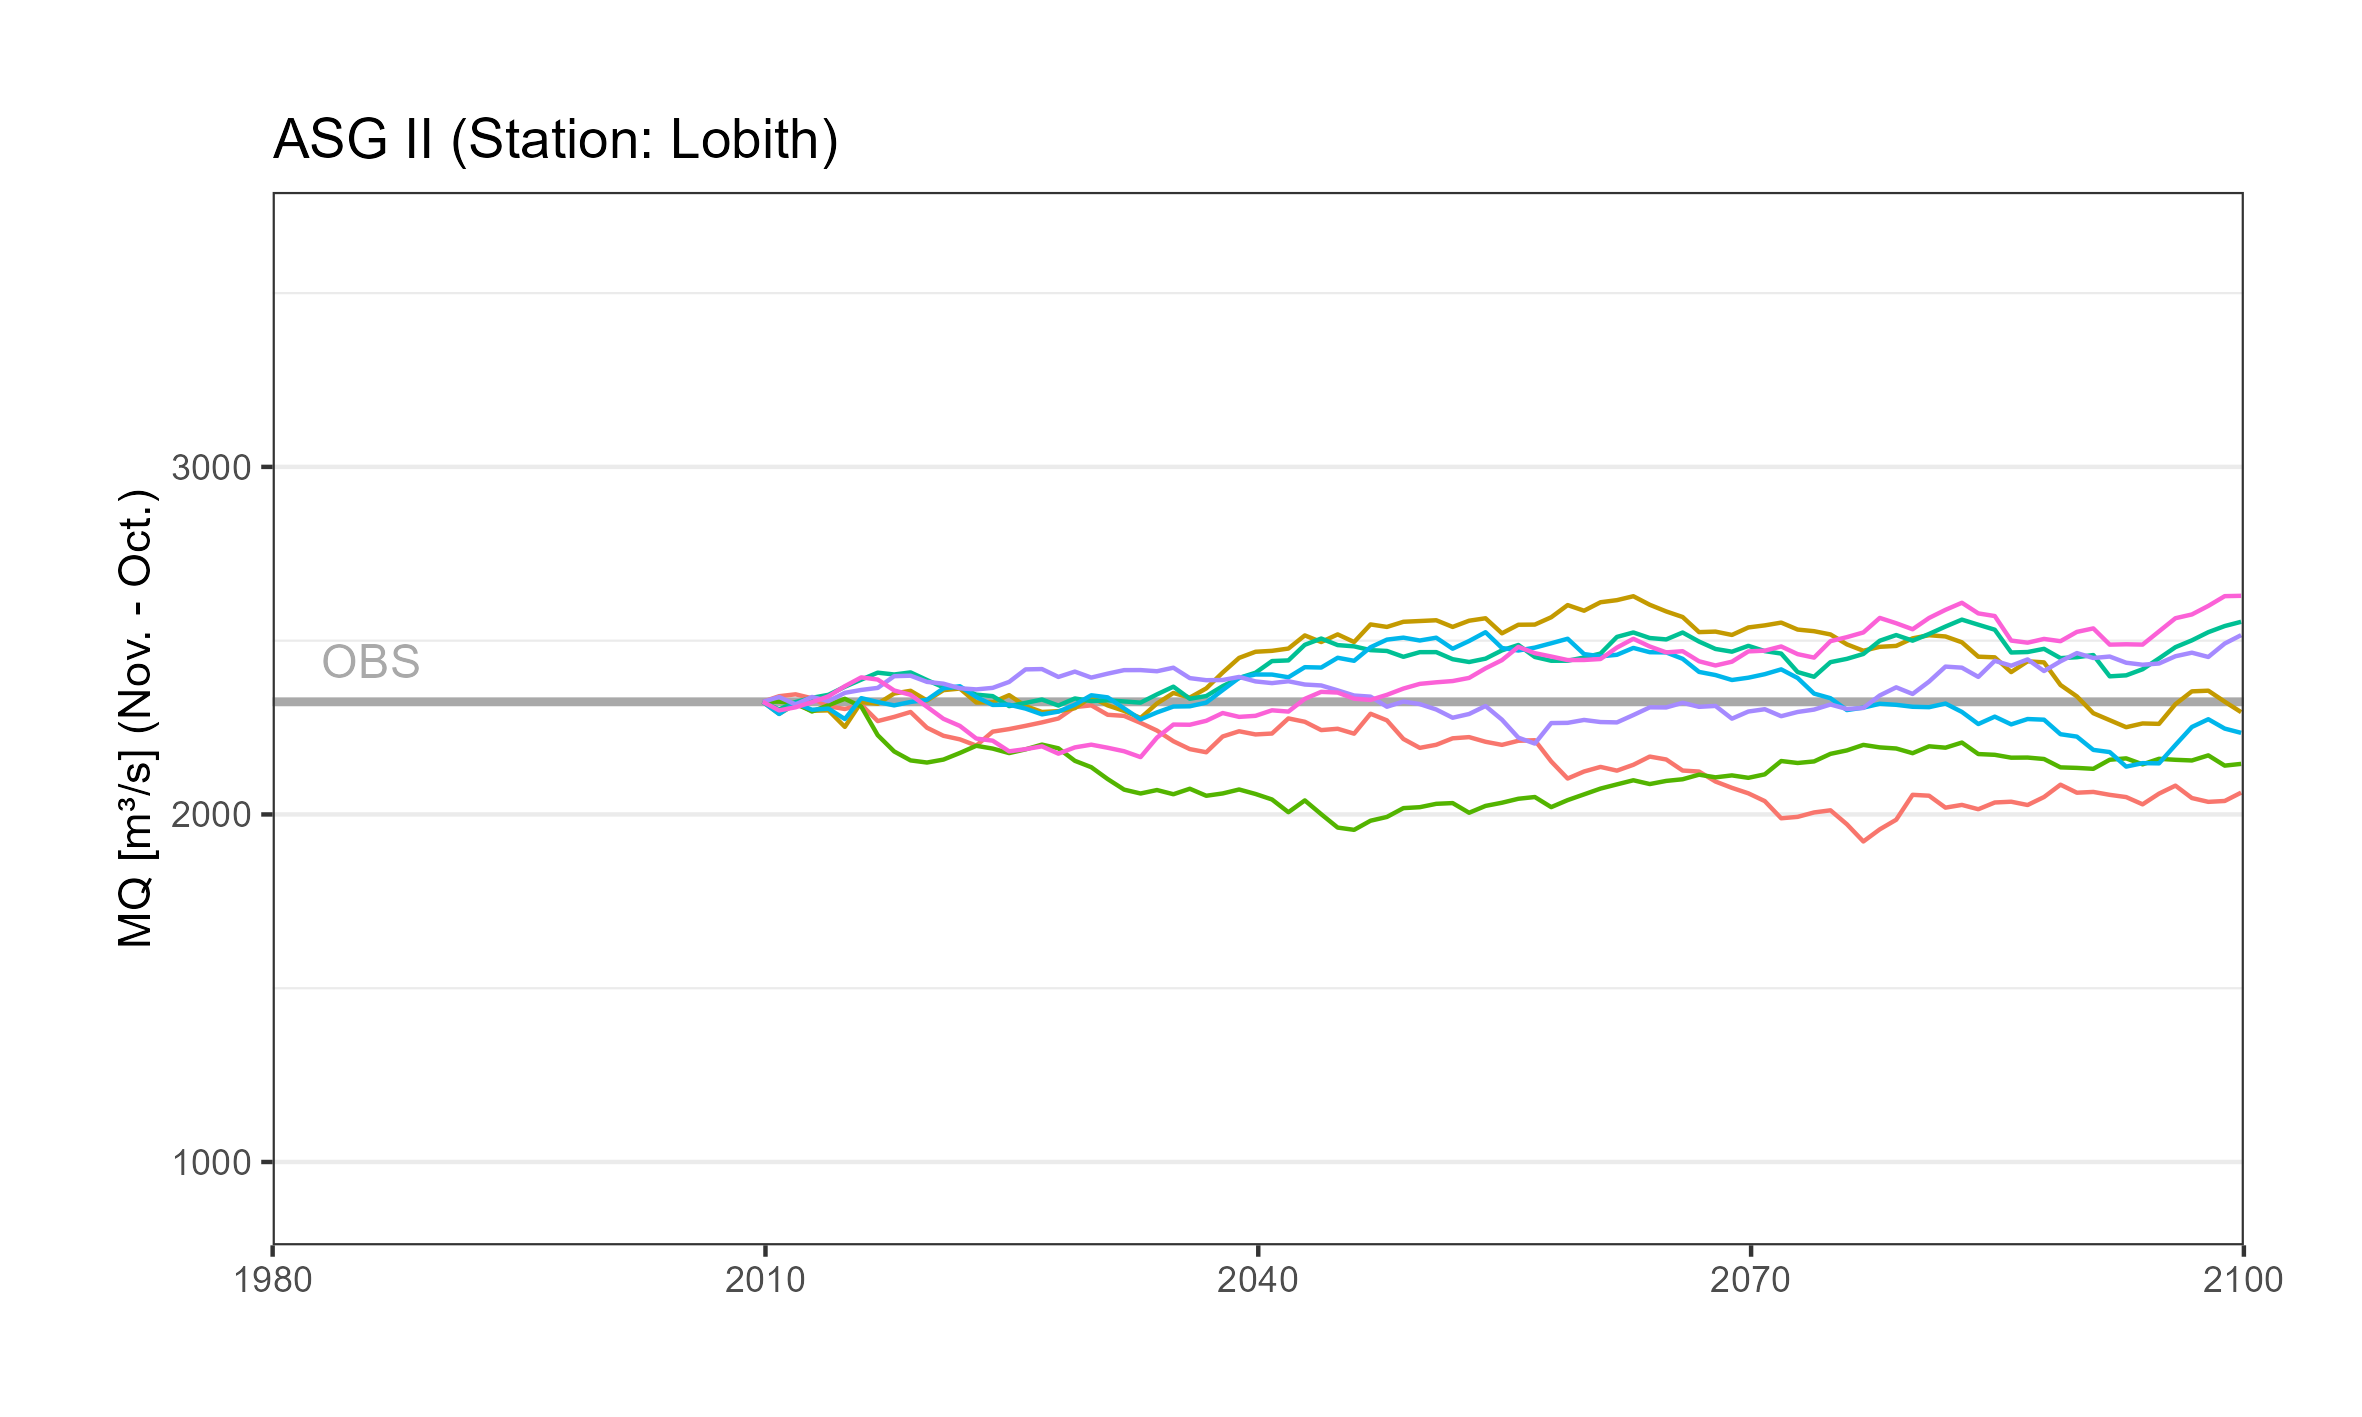
Lineplots_ASG2_Lobith_MQ_hydrolYear_summer.png [138.79 KB]
Observed data
observed-data_6.csv [517 bytes]
Projection
projection_6.csv [517 bytes]
Indicators for flood extremes (HQt)
HQT_LOBITH_0.xlsx [10.71 KB]